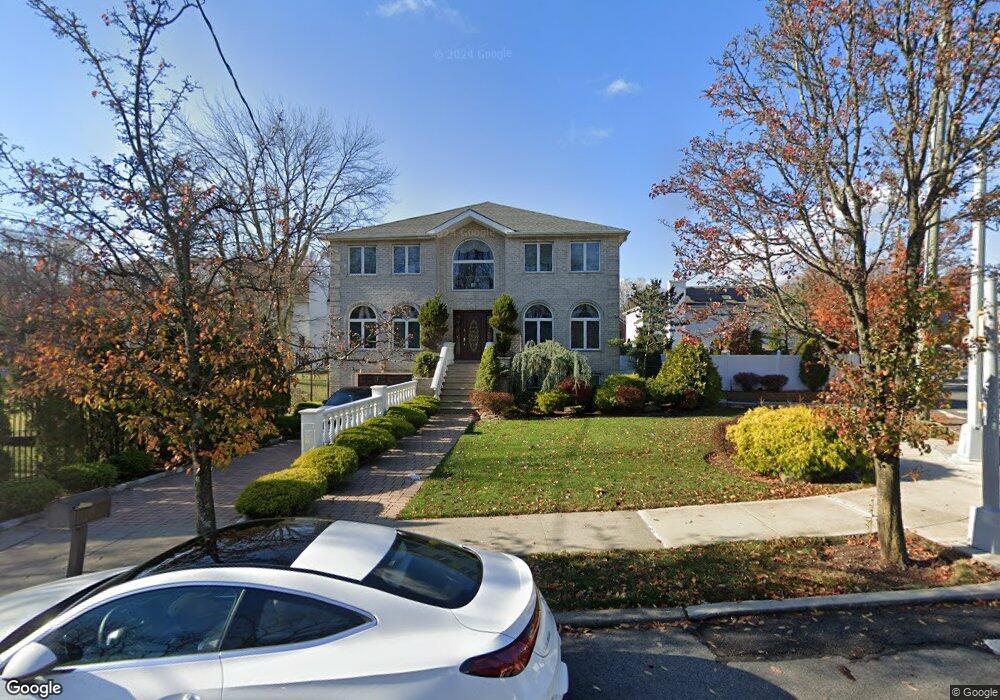
16 Poillon Ave Staten Island, NY 10312
Huguenot NeighborhoodEstimated Value: $1,295,098 - $1,686,000
--
Bed
--
Bath
3,192
Sq Ft
$472/Sq Ft
Est. Value
About This Home
This home is located at 16 Poillon Ave, Staten Island, NY 10312 and is currently estimated at $1,507,775, approximately $472 per square foot. 16 Poillon Ave is a home located in Richmond County with nearby schools including P.S. 5 - Huguenot, I.S. 007 Elias Bernstein, and Tottenville High School.
Ownership History
Date
Name
Owned For
Owner Type
Purchase Details
Closed on
Jan 18, 2000
Sold by
A T P Development Corp
Bought by
Indelicato Linda and Indelicato Anthony
Current Estimated Value
Home Financials for this Owner
Home Financials are based on the most recent Mortgage that was taken out on this home.
Original Mortgage
$350,000
Outstanding Balance
$112,375
Interest Rate
7.98%
Estimated Equity
$1,395,400
Purchase Details
Closed on
Jun 25, 1998
Sold by
Jupiter Enterprises Inc
Bought by
Murthy Sreenivasa and Murthy Nagamani
Purchase Details
Closed on
May 29, 1998
Sold by
Jupiter Enterprises Inc
Bought by
A T P Development Corp
Purchase Details
Closed on
Feb 5, 1998
Sold by
Casey John G
Bought by
Jupiter Enterprises Inc
Purchase Details
Closed on
Aug 4, 1994
Sold by
Chilli Valerie J
Bought by
Jupiter Enterprises Inc
Home Financials for this Owner
Home Financials are based on the most recent Mortgage that was taken out on this home.
Original Mortgage
$100,000
Interest Rate
8.61%
Create a Home Valuation Report for This Property
The Home Valuation Report is an in-depth analysis detailing your home's value as well as a comparison with similar homes in the area
Home Values in the Area
Average Home Value in this Area
Purchase History
| Date | Buyer | Sale Price | Title Company |
|---|---|---|---|
| Indelicato Linda | $560,500 | First American Title Ins Co | |
| Murthy Sreenivasa | $160,000 | -- | |
| A T P Development Corp | $140,000 | -- | |
| Jupiter Enterprises Inc | -- | -- | |
| Jupiter Enterprises Inc | -- | Chicago Title Insurance Co |
Source: Public Records
Mortgage History
| Date | Status | Borrower | Loan Amount |
|---|---|---|---|
| Open | Indelicato Linda | $350,000 | |
| Previous Owner | Jupiter Enterprises Inc | $100,000 |
Source: Public Records
Tax History Compared to Growth
Tax History
| Year | Tax Paid | Tax Assessment Tax Assessment Total Assessment is a certain percentage of the fair market value that is determined by local assessors to be the total taxable value of land and additions on the property. | Land | Improvement |
|---|---|---|---|---|
| 2025 | $13,630 | $67,380 | $21,458 | $45,922 |
| 2024 | $13,630 | $67,860 | $21,855 | $46,005 |
| 2023 | $14,650 | $72,135 | $19,711 | $52,424 |
| 2022 | $13,585 | $74,220 | $20,100 | $54,120 |
| 2021 | $13,511 | $64,200 | $20,100 | $44,100 |
| 2020 | $13,015 | $70,980 | $20,100 | $50,880 |
| 2019 | $12,863 | $70,560 | $20,100 | $50,460 |
| 2018 | $12,440 | $61,026 | $17,340 | $43,686 |
| 2017 | $11,736 | $57,572 | $19,376 | $38,196 |
| 2016 | $10,858 | $54,314 | $21,292 | $33,022 |
| 2015 | $9,833 | $51,240 | $22,620 | $28,620 |
| 2014 | $9,833 | $51,240 | $22,620 | $28,620 |
Source: Public Records
Map
Nearby Homes
- 8 Poillon Ave
- 46 Poillon Ave
- 50 Poillon Ave
- 25 Blue Heron Ct
- 54 Poillon Ave
- 998 Annadale Rd
- 4969 Amboy Rd
- 46 Hillis St
- 970 Annadale Rd
- 76 Downes Ave
- 224 Albee Ave
- 218 Albee Ave
- 26 Buffington Ave
- 67 Archwood Ave
- 42 Mosely Ave
- 50 Buffington Ave
- 151 Lipsett Ave
- 274 S Railroad St
- 199 Downes Ave
- 164 N Railroad St
- 15 Cottontail Ct
- 21 Cottontail Ct
- 22 Poillon Ave
- 5046 Amboy Rd
- 24 Cottontail Ct
- 9 Poillon Ave
- 16 Cottontail Ct
- 30 Cottontail Ct
- 26 Poillon Ave
- 6 Poillon Ave
- 5086 Amboy Rd
- 5041 Amboy Rd
- 36 Cottontail Ct
- 25 Poillon Ave
- 7 Poillon Ave
- 32 Poillon Ave
- 5100 Amboy Rd
- 5091 Amboy Rd
- 44 Cottontail Ct
- 4 Poillon Ave