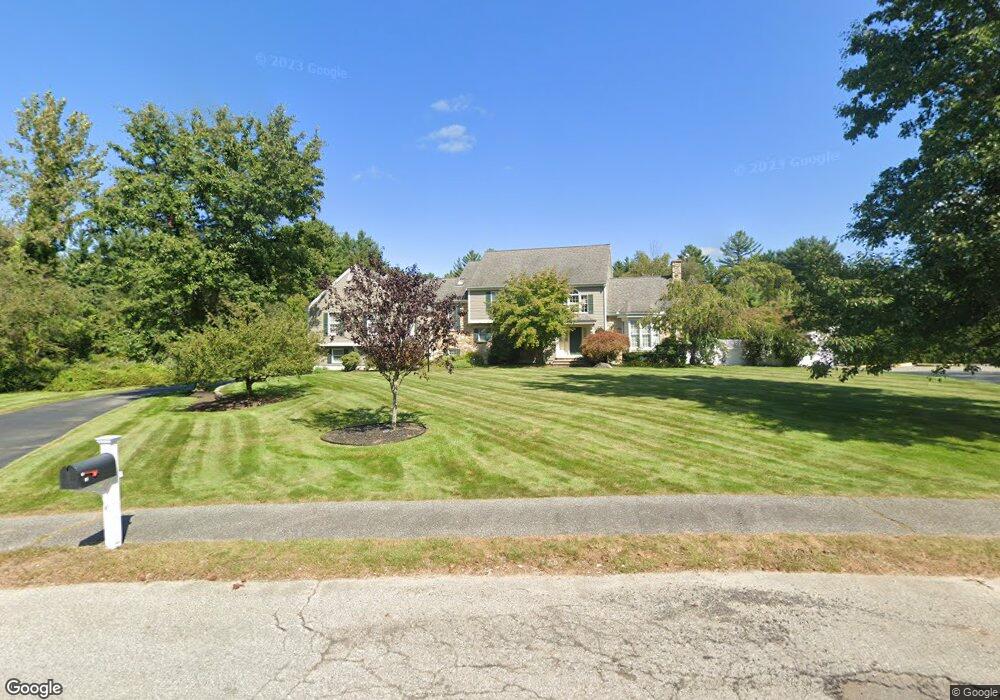
16 Powers Rd Andover, MA 01810
Estimated Value: $1,717,774 - $1,977,000
4
Beds
5
Baths
5,590
Sq Ft
$337/Sq Ft
Est. Value
About This Home
This home is located at 16 Powers Rd, Andover, MA 01810 and is currently estimated at $1,881,694, approximately $336 per square foot. 16 Powers Rd is a home located in Essex County with nearby schools including South Elementary School, Doherty Middle School, and Andover High School.
Ownership History
Date
Name
Owned For
Owner Type
Purchase Details
Closed on
Jun 24, 2010
Sold by
Kletjian Robert P and Kletjian Adrina C
Bought by
Lei Yang and Zhu Binbin
Current Estimated Value
Home Financials for this Owner
Home Financials are based on the most recent Mortgage that was taken out on this home.
Original Mortgage
$400,000
Outstanding Balance
$267,183
Interest Rate
4.98%
Mortgage Type
Purchase Money Mortgage
Estimated Equity
$1,614,511
Create a Home Valuation Report for This Property
The Home Valuation Report is an in-depth analysis detailing your home's value as well as a comparison with similar homes in the area
Purchase History
| Date | Buyer | Sale Price | Title Company |
|---|---|---|---|
| Lei Yang | $892,300 | -- | |
| Lei Yang | $892,300 | -- |
Source: Public Records
Mortgage History
| Date | Status | Borrower | Loan Amount |
|---|---|---|---|
| Open | Lei Yang | $250,000 | |
| Open | Lei Yang | $400,000 | |
| Closed | Lei Yang | $400,000 |
Source: Public Records
Tax History
| Year | Tax Paid | Tax Assessment Tax Assessment Total Assessment is a certain percentage of the fair market value that is determined by local assessors to be the total taxable value of land and additions on the property. | Land | Improvement |
|---|---|---|---|---|
| 2024 | $17,486 | $1,357,600 | $443,300 | $914,300 |
| 2023 | $16,509 | $1,208,600 | $379,000 | $829,600 |
| 2022 | $15,834 | $1,084,500 | $341,600 | $742,900 |
| 2021 | $16,791 | $1,098,200 | $411,300 | $686,900 |
| 2020 | $16,322 | $1,087,400 | $411,300 | $676,100 |
| 2019 | $15,985 | $1,046,800 | $383,300 | $663,500 |
| 2018 | $15,413 | $985,500 | $372,100 | $613,400 |
| 2017 | $14,828 | $976,800 | $364,800 | $612,000 |
| 2016 | $14,556 | $982,200 | $364,800 | $617,400 |
| 2015 | $14,223 | $950,100 | $364,800 | $585,300 |
Source: Public Records
Map
Nearby Homes
- 3 Regency Ridge
- 5 Hillcrest Rd
- 23 Belknap Dr
- 56 Sunset Rock Rd
- 3 West Hollow
- 40 Fiorenza Dr
- 344 S Main St
- 87 Porter Rd
- 18 Dale St Unit 9D
- 72 Tewksbury St
- 4 Hammond Way
- 30 Colonial Dr Unit 5A
- 50 Colonial Dr Unit 8
- 31 Porter Rd
- 16 Porter Rd
- 2 Garfield Ln W
- 17 Karlton Cir
- 11 Cogswell Rd
- 1 Delisio Dr
- 133B Salem
Your Personal Tour Guide
Ask me questions while you tour the home.