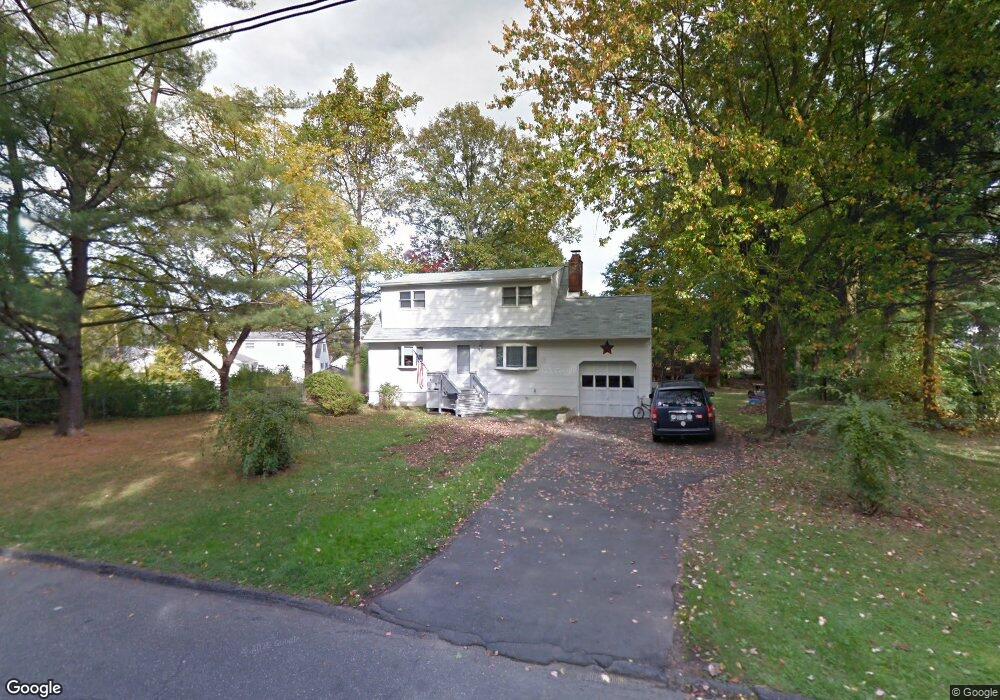
16 Queens Rd Unit 56 New City, NY 10956
Estimated Value: $359,000 - $643,000
4
Beds
2
Baths
1,200
Sq Ft
$469/Sq Ft
Est. Value
About This Home
This home is located at 16 Queens Rd Unit 56, New City, NY 10956 and is currently estimated at $562,529, approximately $468 per square foot. 16 Queens Rd Unit 56 is a home located in Rockland County with nearby schools including Link Elementary School, Felix Festa Middle School, and Clarkstown High School South.
Ownership History
Date
Name
Owned For
Owner Type
Purchase Details
Closed on
Jan 22, 2024
Sold by
Treacy Robert F and Treacy Ellen
Bought by
Treacy Robert F and Treacy Helen
Current Estimated Value
Home Financials for this Owner
Home Financials are based on the most recent Mortgage that was taken out on this home.
Original Mortgage
$175,000
Outstanding Balance
$171,567
Interest Rate
6.88%
Mortgage Type
New Conventional
Estimated Equity
$390,962
Purchase Details
Closed on
Jul 16, 1997
Sold by
Jamin Debra and Nadler Debra J
Bought by
Soffa Christopher Treacy and Soffa Sharon
Home Financials for this Owner
Home Financials are based on the most recent Mortgage that was taken out on this home.
Original Mortgage
$87,975
Interest Rate
7.55%
Mortgage Type
FHA
Create a Home Valuation Report for This Property
The Home Valuation Report is an in-depth analysis detailing your home's value as well as a comparison with similar homes in the area
Home Values in the Area
Average Home Value in this Area
Purchase History
| Date | Buyer | Sale Price | Title Company |
|---|---|---|---|
| Treacy Robert F | -- | Accurate Title | |
| Treacy Robert F | -- | Accurate Title | |
| Treacy Robert F | -- | Accurate Title | |
| Soffa Christopher Treacy | $90,000 | -- | |
| Soffa Christopher Treacy | $90,000 | -- | |
| Soffa Christopher Treacy | $90,000 | -- |
Source: Public Records
Mortgage History
| Date | Status | Borrower | Loan Amount |
|---|---|---|---|
| Open | Treacy Robert F | $175,000 | |
| Closed | Treacy Robert F | $175,000 | |
| Closed | Soffa Christopher Treacy | $87,975 |
Source: Public Records
Tax History Compared to Growth
Tax History
| Year | Tax Paid | Tax Assessment Tax Assessment Total Assessment is a certain percentage of the fair market value that is determined by local assessors to be the total taxable value of land and additions on the property. | Land | Improvement |
|---|---|---|---|---|
| 2024 | $13,687 | $112,500 | $34,700 | $77,800 |
| 2023 | $13,687 | $112,500 | $34,700 | $77,800 |
| 2022 | $10,528 | $112,500 | $34,700 | $77,800 |
| 2021 | $10,528 | $112,500 | $34,700 | $77,800 |
| 2020 | $9,060 | $112,500 | $34,700 | $77,800 |
| 2019 | $9,812 | $112,500 | $34,700 | $77,800 |
| 2018 | $9,812 | $112,500 | $34,700 | $77,800 |
| 2017 | $9,554 | $112,500 | $34,700 | $77,800 |
| 2016 | $9,504 | $112,500 | $34,700 | $77,800 |
| 2015 | -- | $112,500 | $34,700 | $77,800 |
| 2014 | -- | $112,500 | $34,700 | $77,800 |
Source: Public Records
Map
Nearby Homes