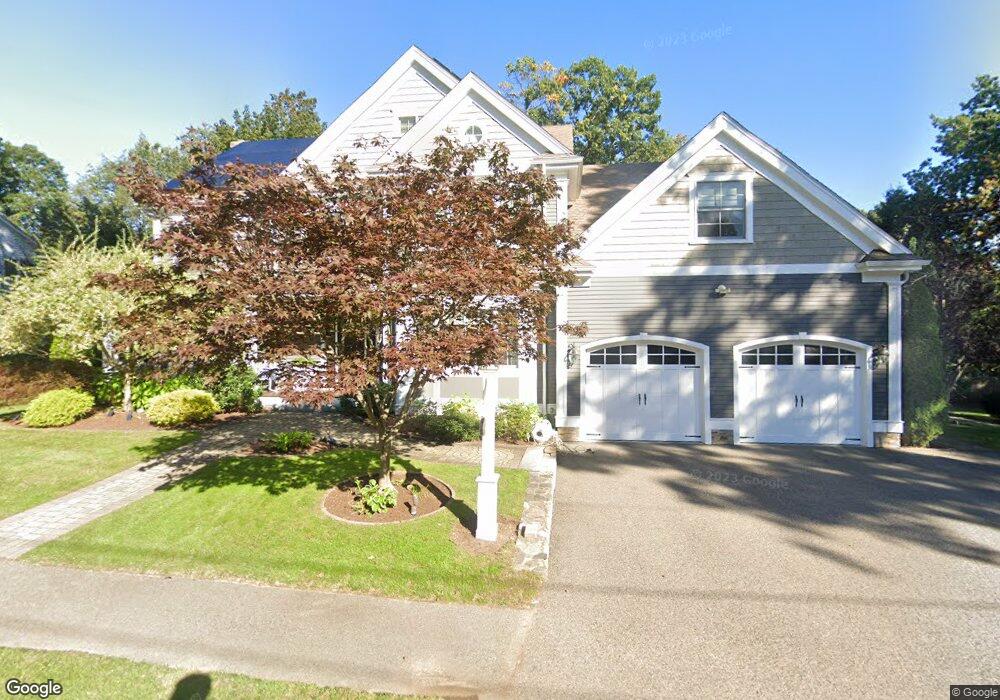
16 Rae Ave Needham, MA 02492
Estimated Value: $1,942,000 - $3,103,000
5
Beds
6
Baths
2,110
Sq Ft
$1,268/Sq Ft
Est. Value
About This Home
This home is located at 16 Rae Ave, Needham, MA 02492 and is currently estimated at $2,675,955, approximately $1,268 per square foot. 16 Rae Ave is a home located in Norfolk County with nearby schools including Mitchell Elementary School, High Rock Middle School, and Pollard Middle School.
Ownership History
Date
Name
Owned For
Owner Type
Purchase Details
Closed on
Oct 14, 2008
Sold by
Welch Steven A and Welch Tracy P
Bought by
Glazer Rachel and Glazer Robert
Current Estimated Value
Create a Home Valuation Report for This Property
The Home Valuation Report is an in-depth analysis detailing your home's value as well as a comparison with similar homes in the area
Home Values in the Area
Average Home Value in this Area
Purchase History
| Date | Buyer | Sale Price | Title Company |
|---|---|---|---|
| Glazer Rachel | $620,000 | -- |
Source: Public Records
Tax History
| Year | Tax Paid | Tax Assessment Tax Assessment Total Assessment is a certain percentage of the fair market value that is determined by local assessors to be the total taxable value of land and additions on the property. | Land | Improvement |
|---|---|---|---|---|
| 2025 | $28,068 | $2,647,900 | $808,100 | $1,839,800 |
| 2024 | $24,999 | $1,996,700 | $594,700 | $1,402,000 |
| 2023 | $24,463 | $1,876,000 | $594,700 | $1,281,300 |
| 2022 | $23,281 | $1,741,300 | $526,900 | $1,214,400 |
| 2021 | $22,689 | $1,741,300 | $526,900 | $1,214,400 |
| 2020 | $21,250 | $1,701,400 | $526,900 | $1,174,500 |
| 2019 | $20,165 | $1,627,500 | $479,500 | $1,148,000 |
| 2018 | $19,335 | $1,627,500 | $479,500 | $1,148,000 |
| 2017 | $17,660 | $1,485,300 | $479,500 | $1,005,800 |
| 2016 | $17,140 | $1,485,300 | $479,500 | $1,005,800 |
| 2015 | $16,769 | $1,485,300 | $479,500 | $1,005,800 |
| 2014 | $15,898 | $1,365,800 | $400,500 | $965,300 |
Source: Public Records
Map
Nearby Homes
- 190 Brookline St
- 168 Richdale Rd
- 26 Pinewood Rd
- 638 Webster St
- 638 Webster St Unit 638
- 40 Otis St Unit L
- 883 Greendale Ave
- 143 Hunting Rd
- 40 High St
- 7 West St
- 5 Hazel Ln
- 26 Gordon Rd
- 19 Highland Ct Unit 19
- 108 Woodbine Cir
- 5 Sachem Rd
- 447 Hillside Ave
- 233 Warren St
- 68 Pleasant St Unit 68
- 100 Rosemary Way Unit 129
- 193 Garden St
Your Personal Tour Guide
Ask me questions while you tour the home.