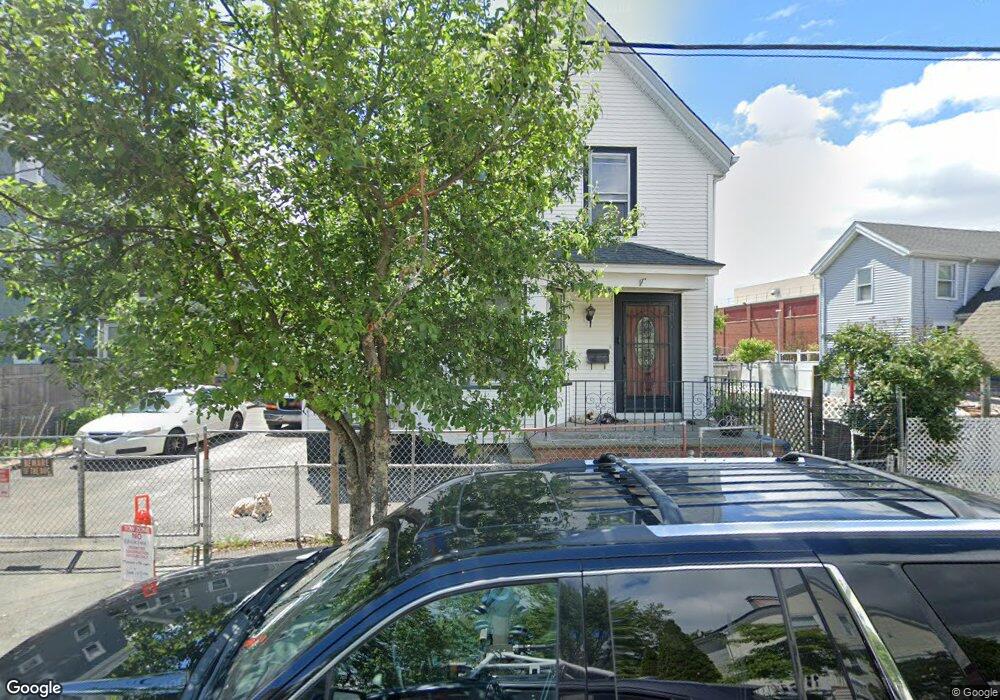
16 Ray St Lynn, MA 01905
Lynnway NeighborhoodEstimated Value: $490,000 - $550,243
3
Beds
1
Bath
1,202
Sq Ft
$431/Sq Ft
Est. Value
About This Home
This home is located at 16 Ray St, Lynn, MA 01905 and is currently estimated at $518,561, approximately $431 per square foot. 16 Ray St is a home located in Essex County with nearby schools including North Park Elementary School, Drewicz Elementary School, and William R. Fallon School.
Ownership History
Date
Name
Owned For
Owner Type
Purchase Details
Closed on
Apr 9, 2010
Sold by
Mcdonough Mark J and Mcdonough Stephen P
Bought by
Sakhen Sina
Current Estimated Value
Home Financials for this Owner
Home Financials are based on the most recent Mortgage that was taken out on this home.
Original Mortgage
$160,047
Interest Rate
5.5%
Mortgage Type
FHA
Create a Home Valuation Report for This Property
The Home Valuation Report is an in-depth analysis detailing your home's value as well as a comparison with similar homes in the area
Home Values in the Area
Average Home Value in this Area
Purchase History
| Date | Buyer | Sale Price | Title Company |
|---|---|---|---|
| Sakhen Sina | $163,000 | -- | |
| Sakhen Sina | $163,000 | -- |
Source: Public Records
Mortgage History
| Date | Status | Borrower | Loan Amount |
|---|---|---|---|
| Open | Sakhen Sina | $159,825 | |
| Closed | Sakhen Sina | $160,047 |
Source: Public Records
Tax History Compared to Growth
Tax History
| Year | Tax Paid | Tax Assessment Tax Assessment Total Assessment is a certain percentage of the fair market value that is determined by local assessors to be the total taxable value of land and additions on the property. | Land | Improvement |
|---|---|---|---|---|
| 2025 | $5,065 | $488,900 | $225,000 | $263,900 |
| 2024 | $4,803 | $456,100 | $206,800 | $249,300 |
| 2023 | $4,489 | $402,600 | $184,200 | $218,400 |
| 2022 | $4,578 | $368,300 | $173,100 | $195,200 |
| 2021 | $4,196 | $322,000 | $142,800 | $179,200 |
| 2020 | $3,747 | $279,600 | $119,200 | $160,400 |
| 2019 | $3,618 | $253,000 | $102,400 | $150,600 |
| 2018 | $3,589 | $236,900 | $112,000 | $124,900 |
| 2017 | $3,370 | $216,000 | $99,000 | $117,000 |
| 2016 | $3,301 | $204,000 | $93,800 | $110,200 |
| 2015 | $2,955 | $176,400 | $80,800 | $95,600 |
Source: Public Records
Map
Nearby Homes
- 8 Ray St
- 16 River St Unit 6
- 15 Neptune Street Ct
- 93 South St
- 3 River Street Ct
- 45 Cottage St Unit 3
- 9 Needhams Landing
- 19 Hood St
- 14 River Street Place
- 28 Margin St Unit A
- 103 Warren St
- 86 Laurel St
- 20 Murray St
- 79 Laurel St
- 39 Centre St
- 693 Western Ave Unit 101
- 20 Huss Ct Unit 105
- 662-664 Western Ave
- 100 Ashland St
- 28 Wyman St