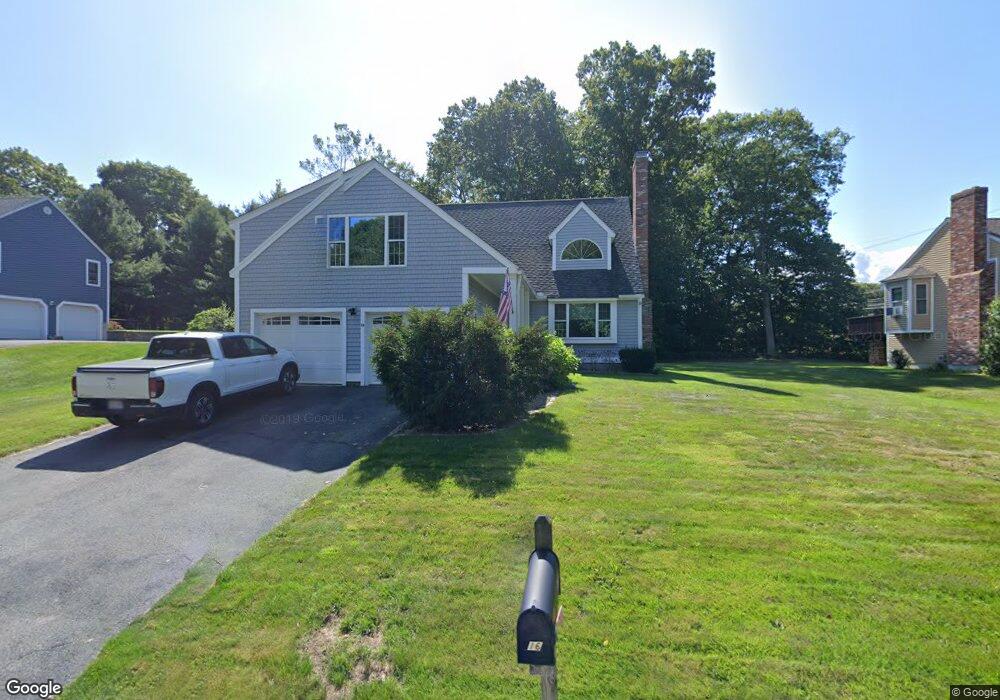
16 Rayburn Dr Millbury, MA 01527
Estimated Value: $639,000 - $884,000
3
Beds
3
Baths
2,632
Sq Ft
$289/Sq Ft
Est. Value
About This Home
This home is located at 16 Rayburn Dr, Millbury, MA 01527 and is currently estimated at $760,183, approximately $288 per square foot. 16 Rayburn Dr is a home located in Worcester County with nearby schools including Elmwood Street Elementary School, Raymond E. Shaw Elementary School, and Millbury Junior/Senior High School.
Ownership History
Date
Name
Owned For
Owner Type
Purchase Details
Closed on
May 30, 1991
Sold by
Quality Home Bldrs Inc
Bought by
Bailey Ronald P and Bailey Theresa L
Current Estimated Value
Home Financials for this Owner
Home Financials are based on the most recent Mortgage that was taken out on this home.
Original Mortgage
$100,000
Interest Rate
9.35%
Mortgage Type
Purchase Money Mortgage
Create a Home Valuation Report for This Property
The Home Valuation Report is an in-depth analysis detailing your home's value as well as a comparison with similar homes in the area
Home Values in the Area
Average Home Value in this Area
Purchase History
| Date | Buyer | Sale Price | Title Company |
|---|---|---|---|
| Bailey Ronald P | $154,000 | -- | |
| Bailey Ronald P | $154,000 | -- |
Source: Public Records
Mortgage History
| Date | Status | Borrower | Loan Amount |
|---|---|---|---|
| Closed | Bailey Ronald P | $88,000 | |
| Closed | Bailey Ronald P | $100,000 |
Source: Public Records
Tax History
| Year | Tax Paid | Tax Assessment Tax Assessment Total Assessment is a certain percentage of the fair market value that is determined by local assessors to be the total taxable value of land and additions on the property. | Land | Improvement |
|---|---|---|---|---|
| 2025 | $8,598 | $642,100 | $138,800 | $503,300 |
| 2024 | $6,463 | $488,500 | $128,600 | $359,900 |
| 2023 | $5,705 | $394,800 | $90,300 | $304,500 |
| 2022 | $5,531 | $368,700 | $86,600 | $282,100 |
| 2021 | $4,883 | $350,700 | $86,600 | $264,100 |
| 2020 | $7,412 | $341,800 | $86,600 | $255,200 |
| 2019 | $5,191 | $327,500 | $75,400 | $252,100 |
| 2018 | $295 | $337,800 | $88,500 | $249,300 |
| 2017 | $4,538 | $276,200 | $88,500 | $187,700 |
| 2016 | $4,426 | $268,900 | $88,500 | $180,400 |
| 2015 | $4,444 | $270,000 | $94,100 | $175,900 |
| 2014 | $4,227 | $247,200 | $90,600 | $156,600 |
Source: Public Records
Map
Nearby Homes
- 2 Riverlin Pkwy
- 20 Woodridge Rd
- 46 Lexington Rd
- Lot 1 Cooper Rd
- 8 Autumn Gate Cir
- 8 Lincoln Ave
- 17 Lincoln Ave
- 7 Canal St
- 37-39 Main St
- 2 Wilson Rd Unit B
- 2 Wilson Rd Unit A
- 48 Macarthur Dr
- 24 Cortland Way
- 8 Sycamore Cir
- 2 Jessica j Dr
- 14 Cortland Way
- 5 Ann Dr Unit 5
- 4 Jessica j Dr
- 150 Ariel Cir
- 2 Diane St
Your Personal Tour Guide
Ask me questions while you tour the home.