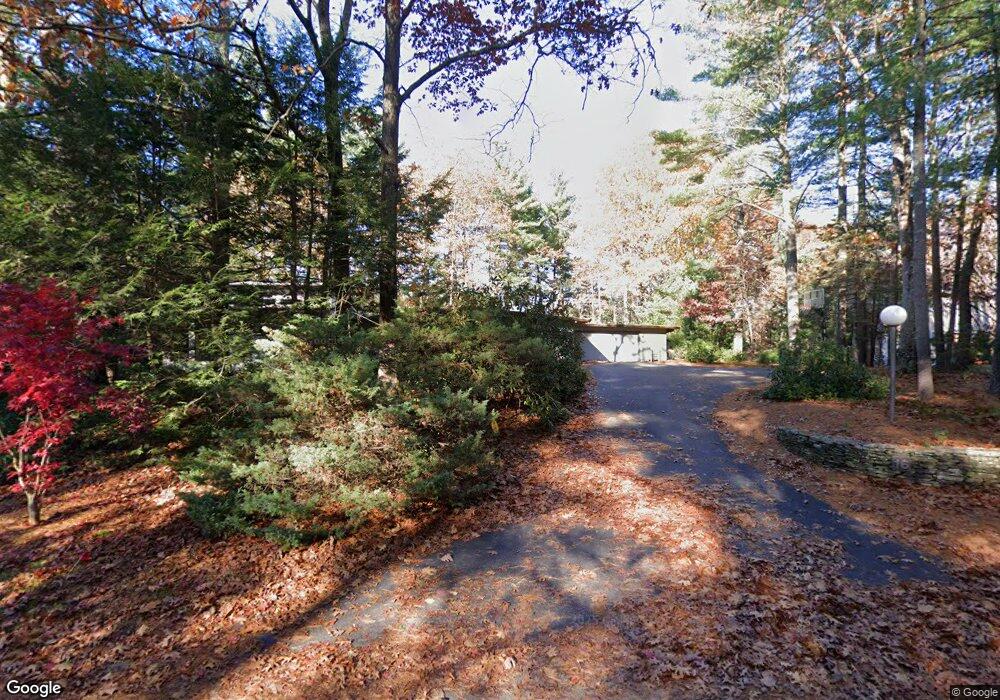
16 Raynor Rd Sudbury, MA 01776
Estimated Value: $1,242,000 - $1,343,000
4
Beds
3
Baths
3,507
Sq Ft
$372/Sq Ft
Est. Value
About This Home
This home is located at 16 Raynor Rd, Sudbury, MA 01776 and is currently estimated at $1,303,466, approximately $371 per square foot. 16 Raynor Rd is a home located in Middlesex County with nearby schools including Peter Noyes Elementary School, Ephraim Curtis Middle School, and Lincoln-Sudbury Regional High School.
Ownership History
Date
Name
Owned For
Owner Type
Purchase Details
Closed on
Apr 23, 1998
Sold by
Favoretto Jose R and Favoretto Nelma M
Bought by
Christelis Gary C and Christelis Dorothea
Current Estimated Value
Home Financials for this Owner
Home Financials are based on the most recent Mortgage that was taken out on this home.
Original Mortgage
$268,800
Interest Rate
7.11%
Mortgage Type
Purchase Money Mortgage
Purchase Details
Closed on
Jul 13, 1987
Sold by
Taylor-Freeman Anna
Bought by
Favoretto Joseph R
Home Financials for this Owner
Home Financials are based on the most recent Mortgage that was taken out on this home.
Original Mortgage
$230,000
Interest Rate
10.71%
Mortgage Type
Purchase Money Mortgage
Create a Home Valuation Report for This Property
The Home Valuation Report is an in-depth analysis detailing your home's value as well as a comparison with similar homes in the area
Home Values in the Area
Average Home Value in this Area
Purchase History
| Date | Buyer | Sale Price | Title Company |
|---|---|---|---|
| Christelis Gary C | $336,000 | -- | |
| Favoretto Joseph R | $292,500 | -- |
Source: Public Records
Mortgage History
| Date | Status | Borrower | Loan Amount |
|---|---|---|---|
| Open | Favoretto Joseph R | $417,000 | |
| Closed | Favoretto Joseph R | $417,000 | |
| Closed | Favoretto Joseph R | $268,800 | |
| Previous Owner | Favoretto Joseph R | $230,000 |
Source: Public Records
Tax History Compared to Growth
Tax History
| Year | Tax Paid | Tax Assessment Tax Assessment Total Assessment is a certain percentage of the fair market value that is determined by local assessors to be the total taxable value of land and additions on the property. | Land | Improvement |
|---|---|---|---|---|
| 2025 | $17,192 | $1,174,300 | $463,600 | $710,700 |
| 2024 | $16,609 | $1,136,800 | $450,000 | $686,800 |
| 2023 | $15,502 | $983,000 | $416,800 | $566,200 |
| 2022 | $14,823 | $821,200 | $382,400 | $438,800 |
| 2021 | $14,271 | $757,900 | $382,400 | $375,500 |
| 2020 | $13,983 | $757,900 | $382,400 | $375,500 |
| 2019 | $13,574 | $757,900 | $382,400 | $375,500 |
| 2018 | $13,266 | $739,900 | $402,400 | $337,500 |
| 2017 | $12,535 | $706,600 | $397,600 | $309,000 |
| 2016 | $12,138 | $681,900 | $382,400 | $299,500 |
| 2015 | $12,433 | $706,400 | $367,600 | $338,800 |
| 2014 | $12,405 | $688,000 | $356,800 | $331,200 |
Source: Public Records
Map
Nearby Homes