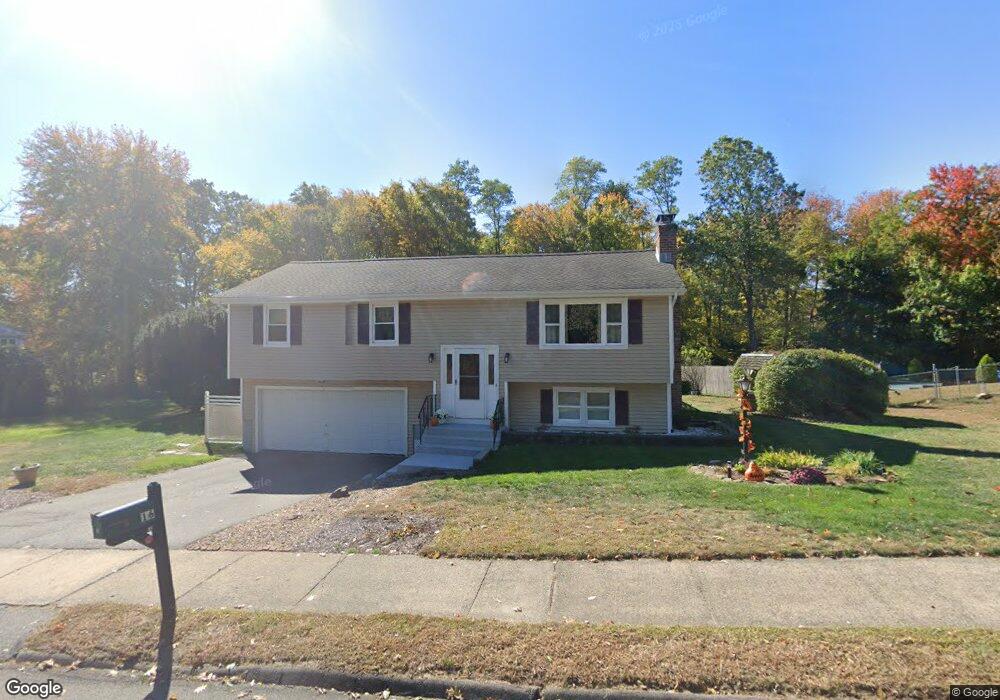
16 Richard Ct Bristol, CT 06010
North Bristol NeighborhoodEstimated Value: $379,000 - $401,000
3
Beds
2
Baths
1,144
Sq Ft
$337/Sq Ft
Est. Value
About This Home
This home is located at 16 Richard Ct, Bristol, CT 06010 and is currently estimated at $386,093, approximately $337 per square foot. 16 Richard Ct is a home located in Hartford County with nearby schools including Ivy Drive School, Northeast Middle School, and Bristol Eastern High School.
Ownership History
Date
Name
Owned For
Owner Type
Purchase Details
Closed on
May 14, 2018
Sold by
Donaroma Frank G
Bought by
Donaroma Frank G and Donaroma Carrie M
Current Estimated Value
Purchase Details
Closed on
Mar 20, 2012
Sold by
Donaroma Christina
Bought by
Donaroma Frank G
Home Financials for this Owner
Home Financials are based on the most recent Mortgage that was taken out on this home.
Original Mortgage
$162,000
Interest Rate
3.86%
Purchase Details
Closed on
Sep 22, 2008
Sold by
Donaroma Frank G
Bought by
Donaroma Christina
Home Financials for this Owner
Home Financials are based on the most recent Mortgage that was taken out on this home.
Original Mortgage
$160,000
Interest Rate
5.87%
Create a Home Valuation Report for This Property
The Home Valuation Report is an in-depth analysis detailing your home's value as well as a comparison with similar homes in the area
Home Values in the Area
Average Home Value in this Area
Purchase History
| Date | Buyer | Sale Price | Title Company |
|---|---|---|---|
| Donaroma Frank G | -- | -- | |
| Donaroma Frank G | $200,000 | -- | |
| Donaroma Christina | $210,000 | -- |
Source: Public Records
Mortgage History
| Date | Status | Borrower | Loan Amount |
|---|---|---|---|
| Previous Owner | Donaroma Christina | $162,000 | |
| Previous Owner | Donaroma Christina | $160,000 | |
| Previous Owner | Donaroma Christina | $103,000 | |
| Previous Owner | Donaroma Christina | $50,000 |
Source: Public Records
Tax History
| Year | Tax Paid | Tax Assessment Tax Assessment Total Assessment is a certain percentage of the fair market value that is determined by local assessors to be the total taxable value of land and additions on the property. | Land | Improvement |
|---|---|---|---|---|
| 2025 | $7,291 | $216,020 | $60,690 | $155,330 |
| 2024 | $6,517 | $204,610 | $60,690 | $143,920 |
| 2023 | $6,210 | $204,610 | $60,690 | $143,920 |
| 2022 | $5,541 | $144,480 | $42,140 | $102,340 |
| 2021 | $5,541 | $144,480 | $42,140 | $102,340 |
| 2020 | $5,541 | $144,480 | $42,140 | $102,340 |
| 2019 | $5,497 | $144,480 | $42,140 | $102,340 |
| 2018 | $5,328 | $144,480 | $42,140 | $102,340 |
| 2017 | $5,233 | $145,250 | $60,270 | $84,980 |
| 2016 | $5,233 | $145,250 | $60,270 | $84,980 |
| 2015 | $5,027 | $145,250 | $60,270 | $84,980 |
| 2014 | $5,027 | $145,250 | $60,270 | $84,980 |
Source: Public Records
Map
Nearby Homes
- 1004 Jerome Ave
- 186 Stevens St
- 25 Sheffield Ln
- 177 Mines Rd
- 143 Sherwood Rd
- 90 Orleans Dr
- 72 Glen Eagle Dr
- 18 Debra Ln
- 14 Bridgeport Ave
- 6 Pine Hill Rd
- 419 Jerome Ave
- 1252 Burlington Ave
- 19 Woodside Way
- 85 Wildewood Run
- 69 Strawberry Hill Rd
- 33 Lufkin Ln
- 35 Jasmine St
- 119 Cherry Hill Dr
- 3 Sandra St
- 14 Burlwood Dr
Your Personal Tour Guide
Ask me questions while you tour the home.