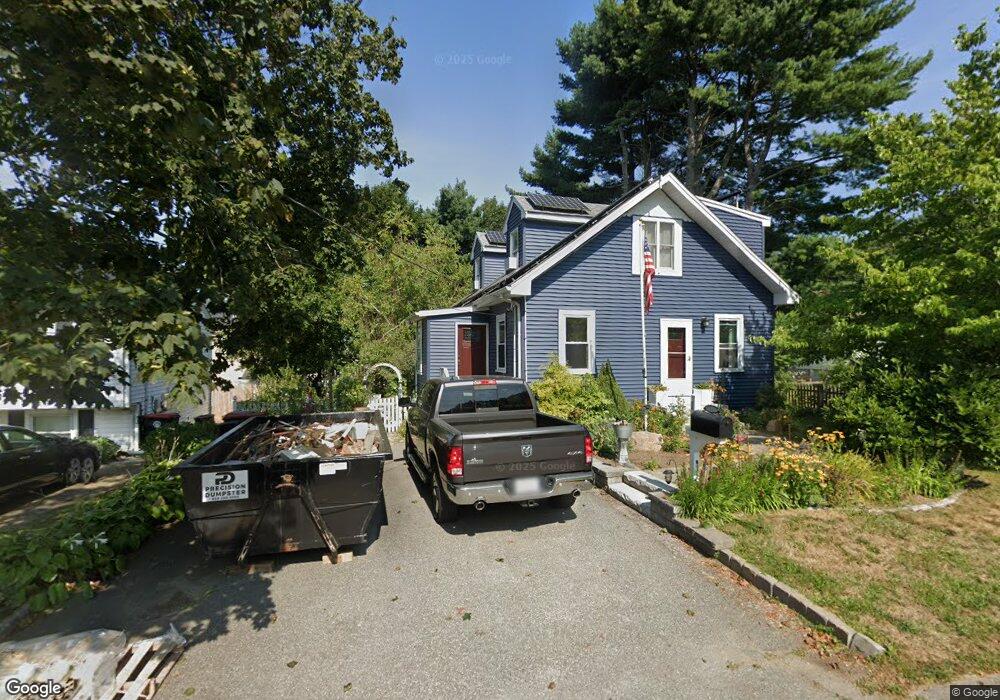
16 Ridge St Brockton, MA 02302
Montello NeighborhoodEstimated Value: $440,000 - $487,078
4
Beds
2
Baths
1,260
Sq Ft
$367/Sq Ft
Est. Value
About This Home
This home is located at 16 Ridge St, Brockton, MA 02302 and is currently estimated at $462,520, approximately $367 per square foot. 16 Ridge St is a home located in Plymouth County with nearby schools including Brookfield Elementary School, Mary E. Baker Elementary School, and Downey Elementary School.
Ownership History
Date
Name
Owned For
Owner Type
Purchase Details
Closed on
Oct 28, 1998
Sold by
Keene Benton W
Bought by
Calrson Sean R and Carlson Renee M
Current Estimated Value
Purchase Details
Closed on
Aug 13, 1998
Sold by
Brundige Steven P and Keene Bentonw W
Bought by
Keene Benton W
Purchase Details
Closed on
Mar 27, 1989
Sold by
Balsavich John C
Bought by
Brundige Steven P
Create a Home Valuation Report for This Property
The Home Valuation Report is an in-depth analysis detailing your home's value as well as a comparison with similar homes in the area
Home Values in the Area
Average Home Value in this Area
Purchase History
| Date | Buyer | Sale Price | Title Company |
|---|---|---|---|
| Calrson Sean R | $97,900 | -- | |
| Keene Benton W | $73,100 | -- | |
| Brundige Steven P | $87,900 | -- |
Source: Public Records
Mortgage History
| Date | Status | Borrower | Loan Amount |
|---|---|---|---|
| Open | Brundige Steven P | $259,200 | |
| Closed | Brundige Steven P | $54,000 | |
| Closed | Brundige Steven P | $161,250 |
Source: Public Records
Tax History Compared to Growth
Tax History
| Year | Tax Paid | Tax Assessment Tax Assessment Total Assessment is a certain percentage of the fair market value that is determined by local assessors to be the total taxable value of land and additions on the property. | Land | Improvement |
|---|---|---|---|---|
| 2025 | $4,743 | $391,700 | $143,900 | $247,800 |
| 2024 | $4,446 | $369,900 | $143,900 | $226,000 |
| 2023 | $4,395 | $338,600 | $108,600 | $230,000 |
| 2022 | $4,132 | $295,800 | $98,600 | $197,200 |
| 2021 | $4,147 | $286,000 | $90,900 | $195,100 |
| 2020 | $4,022 | $265,500 | $87,400 | $178,100 |
| 2019 | $3,647 | $234,700 | $80,700 | $154,000 |
| 2018 | $3,270 | $203,600 | $80,700 | $122,900 |
| 2017 | $3,098 | $192,400 | $80,700 | $111,700 |
| 2016 | $3,021 | $174,000 | $76,900 | $97,100 |
| 2015 | $2,661 | $146,600 | $76,900 | $69,700 |
| 2014 | $2,837 | $156,500 | $76,900 | $79,600 |
Source: Public Records
Map
Nearby Homes