
Seller's Agent in 2025
Rina Brooke
Local Realty
(516) 330-4113
4 in this area
21 Total Sales
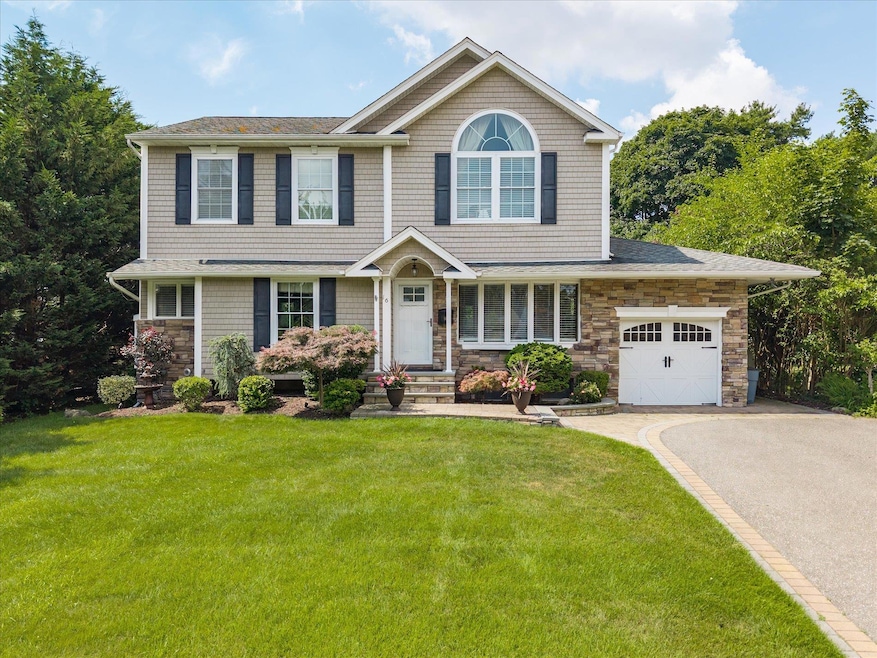
Majestic 3 Bedroom, 3.5 Bath Home with Private Resort-Style Backyard!
Perched high atop a beautiful block, this stunning home offers the perfect blend of style, comfort, and entertaining space—inside and out.
Step inside to an open and airy floor plan featuring a spacious living room with fireplace, formal dining area, den, and a bright, flowing kitchen that opens to a large family room. Perfect for gatherings or quiet evenings, this layout delivers space and flexibility for every lifestyle.
Upstairs, you'll find a sprawling primary suite with cathedral ceilings, walk-in closet, and private ensuite bathroom. Two additional bedrooms and bathrooms provide comfort for guests or family, plus bonus areas ideal for work-from-home, hobbies, or extra storage. Finished basement great for added room and play area.
Enjoy true luxury living in your private backyard oasis featuring a 30,000-gallon in-ground pool with new liner, waterfall, and new saltwater system. Entertain with ease at the built-in BBQ, gather around the fire pit, and relax surrounded by lush landscaping supported by a new sprinkler system. Key Features: 3 Bedrooms, 3.5 Bathrooms Located at high elevation with grand views Spacious, flowing layout with multiple living areas This home is ideal for those who love to entertain or simply enjoy their own private getaway. With thoughtful updates, resort-style amenities, and space to spread out, this is the one you’ve been waiting for.
Last Agent to Sell the Property
Local Realty Brokerage Phone: 516-330-4113 License #10301219763 Listed on: 07/23/2025
| Date | Type | Sale Price | Title Company |
|---|---|---|---|
| Deed | $950,000 | -- | |
| Deed | $629,000 | -- | |
| Bargain Sale Deed | $385,000 | First American Title Ins Co | |
| Deed | $197,000 | Security Title & Guaranty Co |
| Date | Status | Loan Amount | Loan Type |
|---|---|---|---|
| Previous Owner | $322,700 | Purchase Money Mortgage | |
| Previous Owner | $157,000 | Purchase Money Mortgage |
| Date | Event | Price | List to Sale | Price per Sq Ft |
|---|---|---|---|---|
| 11/17/2025 11/17/25 | Sold | $950,000 | 0.0% | $379 / Sq Ft |
| 08/23/2025 08/23/25 | Pending | -- | -- | -- |
| 07/28/2025 07/28/25 | Off Market | $950,000 | -- | -- |
| 07/23/2025 07/23/25 | For Sale | $889,000 | -- | $354 / Sq Ft |
| Year | Tax Paid | Tax Assessment Tax Assessment Total Assessment is a certain percentage of the fair market value that is determined by local assessors to be the total taxable value of land and additions on the property. | Land | Improvement |
|---|---|---|---|---|
| 2024 | $16,846 | $6,143 | $325 | $5,818 |
| 2023 | $16,846 | $6,143 | $325 | $5,818 |
| 2022 | $13,602 | $6,143 | $325 | $5,818 |
| 2021 | $13,602 | $6,143 | $325 | $5,818 |
| 2020 | $16,183 | $6,143 | $325 | $5,818 |
| 2019 | $16,183 | $0 | $0 | $0 |
| 2018 | -- | $6,143 | $325 | $5,818 |
| 2017 | $13,787 | $6,143 | $325 | $5,818 |
| 2016 | $13,609 | $6,143 | $325 | $5,818 |
| 2015 | -- | $6,143 | $325 | $5,818 |
| 2014 | -- | $6,143 | $325 | $5,818 |
Seller's Agent in 2025
Rina Brooke
Local Realty
(516) 330-4113
4 in this area
21 Total Sales
Seller Co-Listing Agent in 2025
Ryan Braswell
Local Realty
(516) 506-3060
1 in this area
38 Total Sales
Buyer's Agent in 2025
Joanne Hantzopoulos
Douglas Elliman Real Estate
(646) 210-8881
1 in this area
54 Total Sales
Source: OneKey® MLS
MLS Number: 893058
APN: 0800-178-00-02-00-010-000
Disclaimer: Certain information contained herein is derived from information provided by parties other than Homes.com. All information provided is deemed reliable, but is not guaranteed to be accurate and should be independently verified.
![]() The data relating to real estate for sale or lease on this web site comes in part from OneKey® MLS. Real estate listings held by brokerage firms other than Ten-X are marked with the OneKey® MLS logo or an abbreviated logo and detailed information about them includes the name of the listing broker.
The data relating to real estate for sale or lease on this web site comes in part from OneKey® MLS. Real estate listings held by brokerage firms other than Ten-X are marked with the OneKey® MLS logo or an abbreviated logo and detailed information about them includes the name of the listing broker.
Based on information submitted to the MLS GRID. All data is obtained from various sources and may not have been verified by broker or MLS GRID. Supplied Open House Information is subject to change without notice. All information should be independently reviewed and verified for accuracy. Properties may or may not be listed by the office/agent presenting the information. Some IDX listings have been excluded from this website. IDX information is provided exclusively for personal, non-commercial use, and may not be used for any purpose other than to identify prospective properties consumers may be interested in purchasing.
Information is deemed reliable but not guaranteed.
Copyright 2026 OneKey® MLS. All rights reserved.
Based on information submitted to the MLS GRID
Ask me questions while you tour the home.