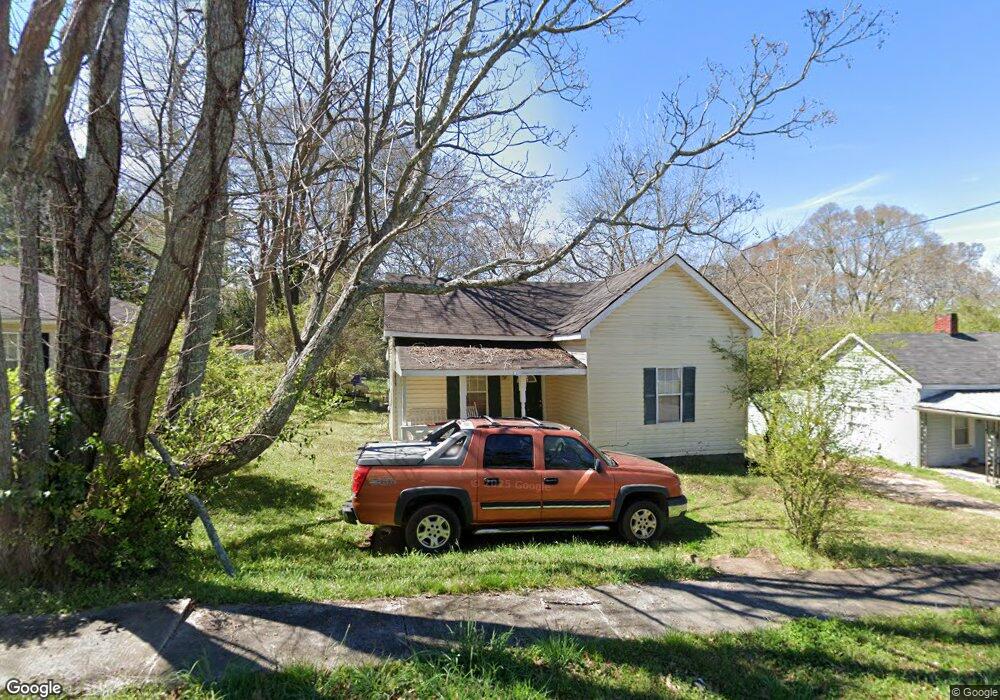
16 Robertson St Lagrange, GA 30241
Estimated Value: $71,000 - $90,241
1
Bed
1
Bath
873
Sq Ft
$94/Sq Ft
Est. Value
About This Home
This home is located at 16 Robertson St, Lagrange, GA 30241 and is currently estimated at $81,810, approximately $93 per square foot. 16 Robertson St is a home located in Troup County with nearby schools including Hollis Hand Elementary School, Franklin Forest Elementary School, and Ethel W. Kight Elementary School.
Ownership History
Date
Name
Owned For
Owner Type
Purchase Details
Closed on
Nov 22, 2011
Sold by
Federal National Mortgage Association
Bought by
Barnes James S
Current Estimated Value
Purchase Details
Closed on
Sep 6, 2011
Sold by
Jpmorgan Chase Bank
Bought by
Federal National Mtg
Purchase Details
Closed on
Jun 27, 2003
Sold by
Charles Akers
Bought by
Taylor Joyce
Purchase Details
Closed on
Apr 7, 2003
Sold by
Constance Geraud J and Constance Mansour
Bought by
Charles Akers
Purchase Details
Closed on
Mar 23, 1981
Sold by
Truitt Smith
Bought by
Constance Geraud J and Constance Mansour
Purchase Details
Closed on
Mar 15, 1971
Sold by
Kate Bass
Bought by
Truitt Smith
Purchase Details
Closed on
Jan 1, 1970
Sold by
Annie Mae Grant
Bought by
Kate Bass
Purchase Details
Closed on
Jan 1, 1963
Sold by
Annie John and Annie Mae Grant
Bought by
Annie Mae Grant
Create a Home Valuation Report for This Property
The Home Valuation Report is an in-depth analysis detailing your home's value as well as a comparison with similar homes in the area
Purchase History
| Date | Buyer | Sale Price | Title Company |
|---|---|---|---|
| Barnes James S | $11,000 | -- | |
| Federal National Mtg | $13,500 | -- | |
| Jpmorgan Chase Bank | $13,500 | -- | |
| Taylor Joyce | $38,500 | -- | |
| Charles Akers | $18,000 | -- | |
| Constance Geraud J | $9,000 | -- | |
| Truitt Smith | -- | -- | |
| Kate Bass | -- | -- | |
| Annie Mae Grant | -- | -- |
Source: Public Records
Tax History
| Year | Tax Paid | Tax Assessment Tax Assessment Total Assessment is a certain percentage of the fair market value that is determined by local assessors to be the total taxable value of land and additions on the property. | Land | Improvement |
|---|---|---|---|---|
| 2025 | $561 | $20,560 | $1,880 | $18,680 |
| 2024 | $513 | $18,800 | $1,880 | $16,920 |
| 2023 | $400 | $14,680 | $1,880 | $12,800 |
| 2022 | $384 | $13,760 | $1,880 | $11,880 |
| 2021 | $285 | $9,440 | $1,880 | $7,560 |
| 2020 | $285 | $9,440 | $1,880 | $7,560 |
| 2019 | $271 | $9,000 | $1,880 | $7,120 |
| 2018 | $271 | $9,000 | $1,880 | $7,120 |
| 2017 | $271 | $9,000 | $1,880 | $7,120 |
| 2016 | $271 | $8,970 | $1,890 | $7,080 |
| 2015 | $271 | $8,970 | $1,890 | $7,080 |
| 2014 | $260 | $8,597 | $1,890 | $6,707 |
| 2013 | -- | $9,084 | $1,890 | $7,194 |
Source: Public Records
Map
Nearby Homes
Your Personal Tour Guide
Ask me questions while you tour the home.