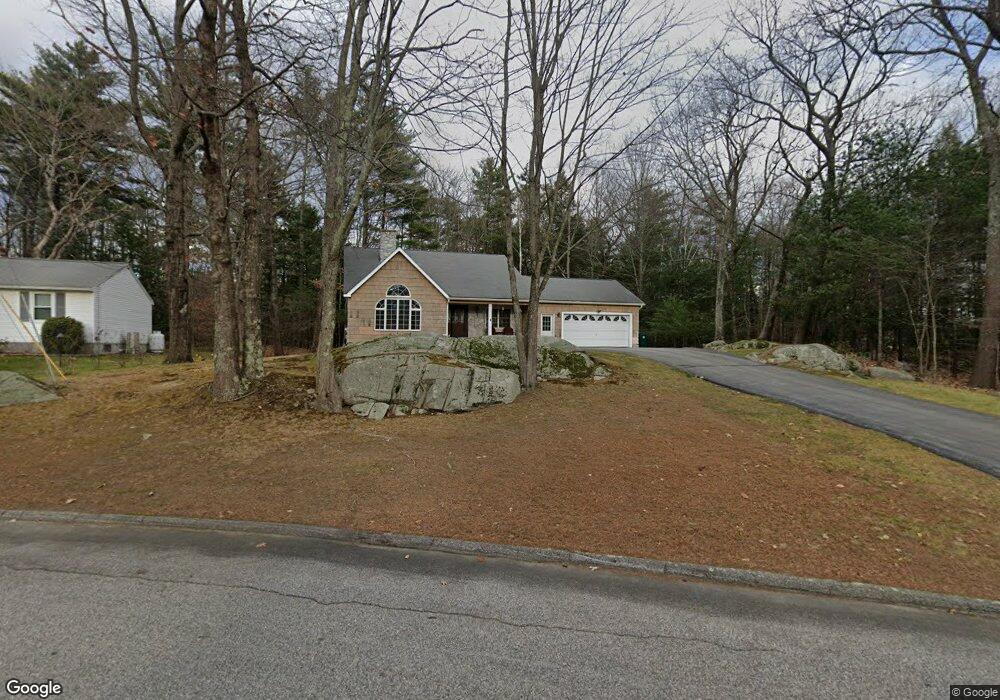
16 Robin Cir Biddeford, ME 04005
Estimated Value: $553,624 - $575,000
4
Beds
2
Baths
1,712
Sq Ft
$328/Sq Ft
Est. Value
About This Home
This home is located at 16 Robin Cir, Biddeford, ME 04005 and is currently estimated at $561,656, approximately $328 per square foot. 16 Robin Cir is a home located in York County with nearby schools including John F Kennedy Memorial School, Biddeford Primary School, and Biddeford Intermediate School.
Ownership History
Date
Name
Owned For
Owner Type
Purchase Details
Closed on
Feb 25, 2005
Sold by
Mackenzie Brenda L
Bought by
Evans Lindsay R and Evans Kathleen R
Current Estimated Value
Home Financials for this Owner
Home Financials are based on the most recent Mortgage that was taken out on this home.
Original Mortgage
$221,200
Outstanding Balance
$103,856
Interest Rate
5%
Mortgage Type
Adjustable Rate Mortgage/ARM
Estimated Equity
$457,800
Create a Home Valuation Report for This Property
The Home Valuation Report is an in-depth analysis detailing your home's value as well as a comparison with similar homes in the area
Home Values in the Area
Average Home Value in this Area
Purchase History
| Date | Buyer | Sale Price | Title Company |
|---|---|---|---|
| Evans Lindsay R | -- | -- | |
| Evans Lindsay R | -- | -- |
Source: Public Records
Mortgage History
| Date | Status | Borrower | Loan Amount |
|---|---|---|---|
| Open | Evans Lindsay R | $221,200 | |
| Closed | Evans Lindsay R | $221,200 |
Source: Public Records
Tax History
| Year | Tax Paid | Tax Assessment Tax Assessment Total Assessment is a certain percentage of the fair market value that is determined by local assessors to be the total taxable value of land and additions on the property. | Land | Improvement |
|---|---|---|---|---|
| 2025 | $6,783 | $454,000 | $155,600 | $298,400 |
| 2024 | $6,375 | $448,300 | $155,600 | $292,700 |
| 2023 | $5,849 | $445,800 | $153,100 | $292,700 |
| 2022 | $5,599 | $341,200 | $88,100 | $253,100 |
| 2021 | $5,263 | $288,700 | $75,900 | $212,800 |
| 2020 | $5,225 | $260,600 | $66,800 | $193,800 |
| 2019 | $5,207 | $260,600 | $66,800 | $193,800 |
| 2018 | $5,134 | $260,600 | $66,800 | $193,800 |
| 2017 | $5,088 | $253,500 | $66,800 | $186,700 |
| 2016 | $5,035 | $253,500 | $66,800 | $186,700 |
| 2015 | $4,936 | $253,500 | $66,800 | $186,700 |
| 2014 | $4,692 | $247,100 | $66,800 | $180,300 |
| 2013 | -- | $248,500 | $74,200 | $174,300 |
Source: Public Records
Map
Nearby Homes
Your Personal Tour Guide
Ask me questions while you tour the home.