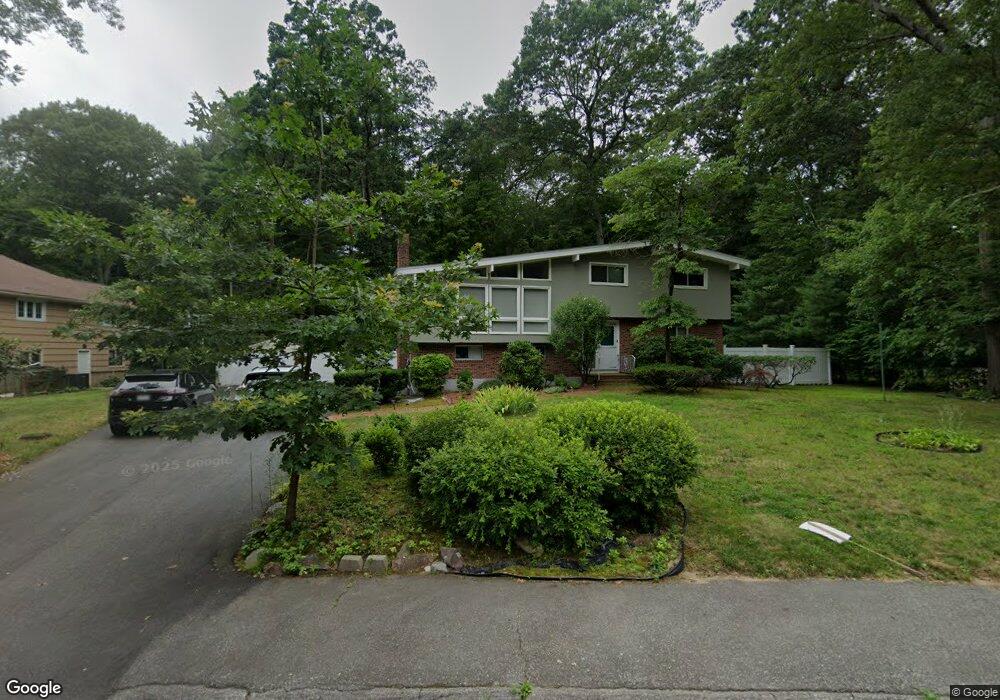
16 Robin Rd Sharon, MA 02067
Estimated Value: $837,000 - $958,000
3
Beds
3
Baths
2,020
Sq Ft
$432/Sq Ft
Est. Value
About This Home
This home is located at 16 Robin Rd, Sharon, MA 02067 and is currently estimated at $872,036, approximately $431 per square foot. 16 Robin Rd is a home located in Norfolk County with nearby schools including Cottage Street Elementary School, Sharon Middle School, and Sharon High School.
Ownership History
Date
Name
Owned For
Owner Type
Purchase Details
Closed on
Dec 22, 2011
Sold by
Avigan David and Avigan Michelle
Bought by
Caproni Richard F and Caproni Dana M
Current Estimated Value
Home Financials for this Owner
Home Financials are based on the most recent Mortgage that was taken out on this home.
Original Mortgage
$304,000
Outstanding Balance
$207,757
Interest Rate
3.99%
Mortgage Type
Purchase Money Mortgage
Estimated Equity
$664,279
Purchase Details
Closed on
Aug 1, 1996
Sold by
Summerfield Myron S and Summerfield Rose H
Bought by
Avigan David and Avigan Michelle
Home Financials for this Owner
Home Financials are based on the most recent Mortgage that was taken out on this home.
Original Mortgage
$211,500
Interest Rate
8.27%
Mortgage Type
Purchase Money Mortgage
Create a Home Valuation Report for This Property
The Home Valuation Report is an in-depth analysis detailing your home's value as well as a comparison with similar homes in the area
Home Values in the Area
Average Home Value in this Area
Purchase History
| Date | Buyer | Sale Price | Title Company |
|---|---|---|---|
| Caproni Richard F | $380,000 | -- | |
| Avigan David | $235,000 | -- |
Source: Public Records
Mortgage History
| Date | Status | Borrower | Loan Amount |
|---|---|---|---|
| Open | Caproni Richard F | $304,000 | |
| Previous Owner | Avigan David | $204,100 | |
| Previous Owner | Avigan David | $211,500 | |
| Previous Owner | Avigan David | $143,200 | |
| Previous Owner | Avigan David | $15,000 |
Source: Public Records
Tax History
| Year | Tax Paid | Tax Assessment Tax Assessment Total Assessment is a certain percentage of the fair market value that is determined by local assessors to be the total taxable value of land and additions on the property. | Land | Improvement |
|---|---|---|---|---|
| 2025 | $13,210 | $755,700 | $472,800 | $282,900 |
| 2024 | $12,598 | $716,600 | $433,700 | $282,900 |
| 2023 | $12,347 | $664,200 | $405,400 | $258,800 |
| 2022 | $11,437 | $579,100 | $337,800 | $241,300 |
| 2021 | $11,310 | $553,600 | $318,800 | $234,800 |
| 2020 | $10,518 | $553,600 | $318,800 | $234,800 |
| 2019 | $10,608 | $546,500 | $296,800 | $249,700 |
| 2018 | $10,473 | $540,700 | $291,000 | $249,700 |
| 2017 | $10,232 | $521,500 | $271,800 | $249,700 |
| 2016 | $10,041 | $499,300 | $271,800 | $227,500 |
| 2015 | $8,958 | $441,300 | $224,600 | $216,700 |
| 2014 | $8,306 | $404,200 | $204,100 | $200,100 |
Source: Public Records
Map
Nearby Homes
- 58 Ames St
- 5 Trowel Pond Shop Rd Unit C
- 133 Ames St
- 22 Ames Ct
- 15 Paul Revere Rd
- 63 Highland St
- 29 Station St
- 136 N Main St
- 11 Wilshire Dr
- 132 Massapoag Ave
- 3 Trowel Shop Pond Rd Unit 3
- 20 Trowel Shop Pond Rd Unit 24
- 16 Trowel Shop Pond Rd Unit 16
- 8 Trowel Shop Pond Rd Unit 8
- 2 Trowel Shop Pond Rd Unit 2
- 12 Trowel Shop Pond Rd Unit 12
- 24 Trowel Shop Pond Rd Unit 24
- 6 Trowel Shop Pond Rd Unit 6
- 61 Lincoln Rd
- 174 E Foxboro St
Your Personal Tour Guide
Ask me questions while you tour the home.