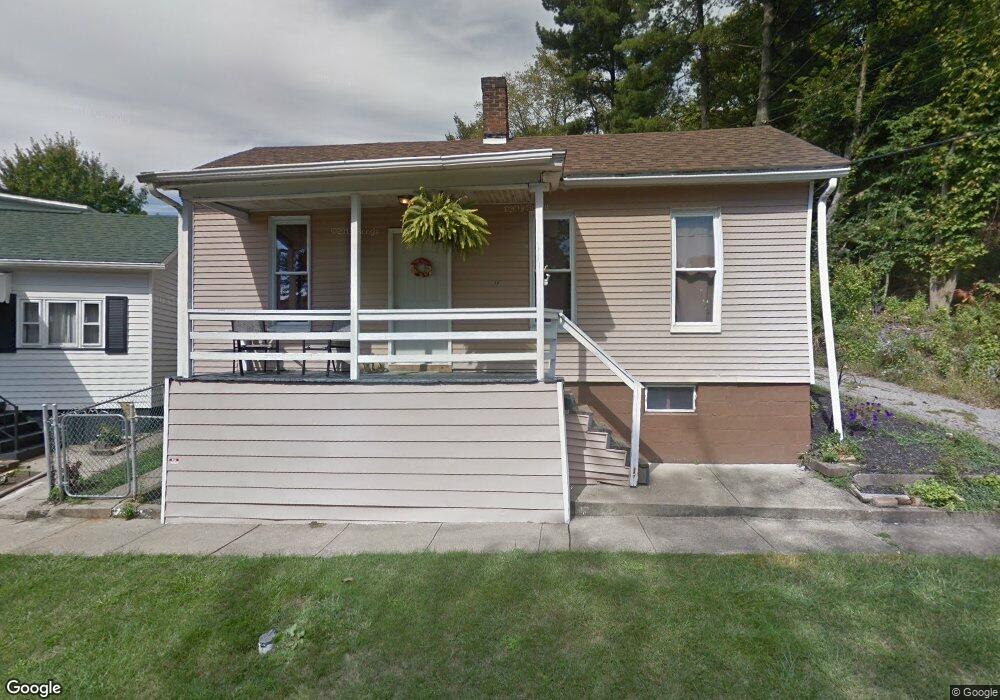
16 Ross St Bridgeport, OH 43912
Estimated Value: $39,000 - $52,000
2
Beds
1
Bath
852
Sq Ft
$55/Sq Ft
Est. Value
About This Home
This home is located at 16 Ross St, Bridgeport, OH 43912 and is currently estimated at $47,020, approximately $55 per square foot. 16 Ross St is a home located in Belmont County with nearby schools including Bridgeport Elementary School, Bridgeport Middle School, and Bridgeport High School.
Ownership History
Date
Name
Owned For
Owner Type
Purchase Details
Closed on
Jan 2, 2025
Sold by
Supanik Kassondra M and Moore Kyle A
Bought by
Liston Karen M and Purpura Karen M
Current Estimated Value
Purchase Details
Closed on
Jul 22, 2009
Sold by
Kennedy Dennis B and Kennedy Donna H
Bought by
Moore Kyle A and Supanik Kassondra M
Home Financials for this Owner
Home Financials are based on the most recent Mortgage that was taken out on this home.
Original Mortgage
$20,619
Interest Rate
5.62%
Mortgage Type
Future Advance Clause Open End Mortgage
Purchase Details
Closed on
Jan 1, 1987
Sold by
Kennedy Dennis B and Kennedy Donna
Bought by
Kennedy Dennis B and Kennedy Donna
Create a Home Valuation Report for This Property
The Home Valuation Report is an in-depth analysis detailing your home's value as well as a comparison with similar homes in the area
Home Values in the Area
Average Home Value in this Area
Purchase History
| Date | Buyer | Sale Price | Title Company |
|---|---|---|---|
| Liston Karen M | $48,000 | None Listed On Document | |
| Liston Karen M | $48,000 | None Listed On Document | |
| Moore Kyle A | $25,000 | Attorney | |
| Kennedy Dennis B | -- | -- |
Source: Public Records
Mortgage History
| Date | Status | Borrower | Loan Amount |
|---|---|---|---|
| Previous Owner | Moore Kyle A | $20,619 |
Source: Public Records
Tax History Compared to Growth
Tax History
| Year | Tax Paid | Tax Assessment Tax Assessment Total Assessment is a certain percentage of the fair market value that is determined by local assessors to be the total taxable value of land and additions on the property. | Land | Improvement |
|---|---|---|---|---|
| 2024 | $695 | $18,790 | $1,650 | $17,140 |
| 2023 | $520 | $12,690 | $1,650 | $11,040 |
| 2022 | $520 | $12,694 | $1,652 | $11,042 |
| 2021 | $528 | $12,694 | $1,652 | $11,042 |
| 2020 | $458 | $11,050 | $1,440 | $9,610 |
| 2019 | $460 | $11,050 | $1,440 | $9,610 |
| 2018 | $423 | $11,050 | $1,440 | $9,610 |
| 2017 | $374 | $8,130 | $830 | $7,300 |
| 2016 | $371 | $8,130 | $830 | $7,300 |
| 2015 | $369 | $8,130 | $830 | $7,300 |
| 2014 | $377 | $8,050 | $750 | $7,300 |
| 2013 | $351 | $8,050 | $750 | $7,300 |
Source: Public Records
Map
Nearby Homes
- 866 Main St
- 20 Locust Ave
- 902 National Rd
- 16 Patterson Rd
- 8 Spring St
- 56624 Boyd Ave
- 56559 Boyd Ave
- 67478 Kirkwood Heights Rd
- 61 Laipple St
- 67605 Kirkwood Heights Rd
- 67620 Kirkwood Heights Rd
- 67730 Kirkwood Heights Rd
- 0 Ohio 7
- 69341 Old Cadiz Rd
- 116 Ohio St
- 217 N Huron St
- 301 N Huron St
- 50 Kentucky St
- 55560 Poplar Ave
- 219 S York St