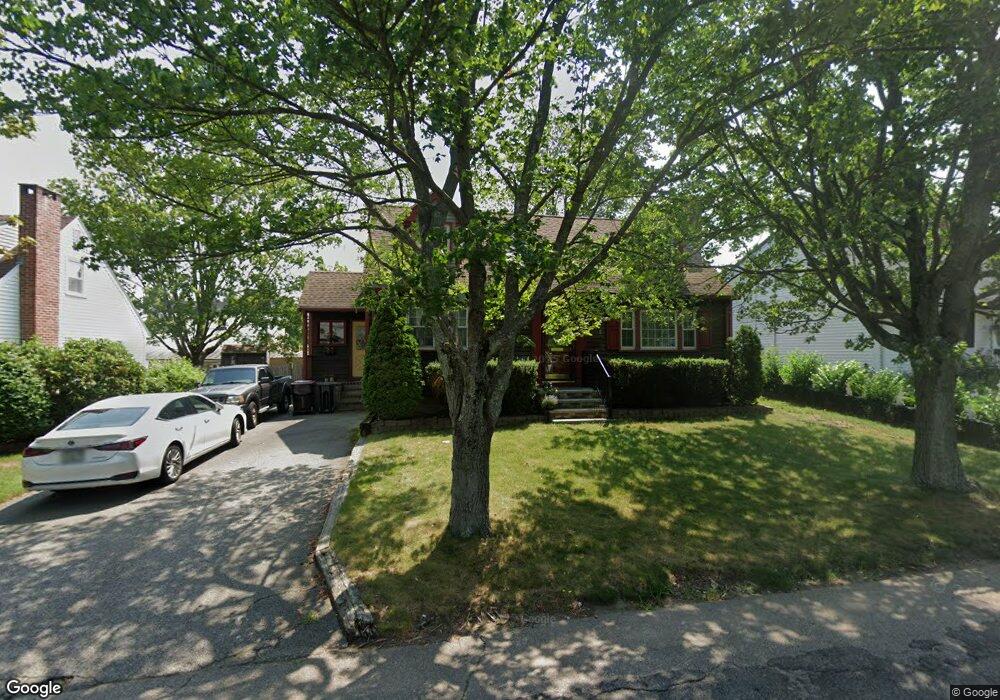
16 Rufus St Brockton, MA 02302
Estimated Value: $492,000 - $522,000
3
Beds
2
Baths
1,428
Sq Ft
$357/Sq Ft
Est. Value
About This Home
This home is located at 16 Rufus St, Brockton, MA 02302 and is currently estimated at $509,220, approximately $356 per square foot. 16 Rufus St is a home located in Plymouth County with nearby schools including Arnone Elementary School, Joseph F. Plouffe Middle School, and Brockton Area Seventh-Day Adventist Academy.
Ownership History
Date
Name
Owned For
Owner Type
Purchase Details
Closed on
Nov 12, 2004
Sold by
Lacouture Jospeh and Lacouture Paula
Bought by
Lacouture Ft
Current Estimated Value
Purchase Details
Closed on
Feb 26, 1976
Bought by
Lacouture Joseph E and Lacocuture Paula G
Create a Home Valuation Report for This Property
The Home Valuation Report is an in-depth analysis detailing your home's value as well as a comparison with similar homes in the area
Home Values in the Area
Average Home Value in this Area
Purchase History
| Date | Buyer | Sale Price | Title Company |
|---|---|---|---|
| Lacouture Ft | -- | -- | |
| Lacouture Joseph E | -- | -- |
Source: Public Records
Mortgage History
| Date | Status | Borrower | Loan Amount |
|---|---|---|---|
| Previous Owner | Lacouture Joseph E | $55,000 | |
| Previous Owner | Lacouture Joseph E | $50,000 |
Source: Public Records
Tax History Compared to Growth
Tax History
| Year | Tax Paid | Tax Assessment Tax Assessment Total Assessment is a certain percentage of the fair market value that is determined by local assessors to be the total taxable value of land and additions on the property. | Land | Improvement |
|---|---|---|---|---|
| 2025 | $5,162 | $426,300 | $137,500 | $288,800 |
| 2024 | $5,124 | $426,300 | $137,500 | $288,800 |
| 2023 | $4,897 | $377,300 | $102,600 | $274,700 |
| 2022 | $4,820 | $345,000 | $93,200 | $251,800 |
| 2021 | $4,378 | $301,900 | $77,100 | $224,800 |
| 2020 | $4,303 | $284,000 | $72,600 | $211,400 |
| 2019 | $4,242 | $273,000 | $70,400 | $202,600 |
| 2018 | $4,021 | $250,400 | $70,400 | $180,000 |
| 2017 | $3,492 | $216,900 | $70,400 | $146,500 |
| 2016 | $3,364 | $193,800 | $68,200 | $125,600 |
| 2015 | $2,908 | $160,200 | $68,200 | $92,000 |
| 2014 | $2,830 | $156,100 | $68,200 | $87,900 |
Source: Public Records
Map
Nearby Homes