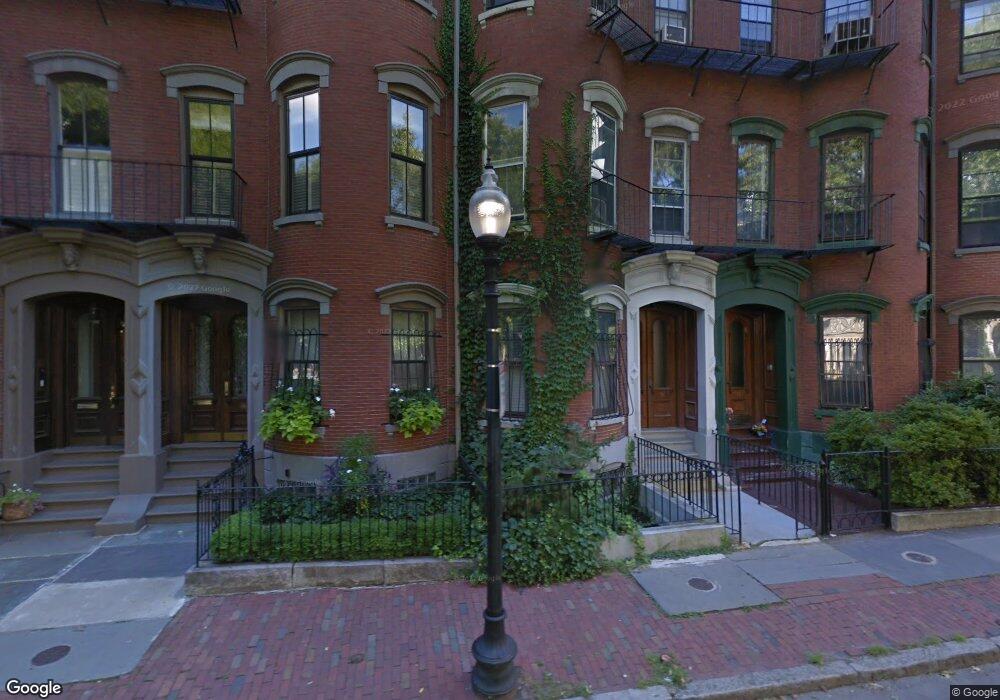
16 Rutland Square Unit 1 Boston, MA 02118
South End NeighborhoodEstimated Value: $1,445,000 - $1,788,000
1
Bed
2
Baths
1,483
Sq Ft
$1,092/Sq Ft
Est. Value
About This Home
This home is located at 16 Rutland Square Unit 1, Boston, MA 02118 and is currently estimated at $1,619,133, approximately $1,091 per square foot. 16 Rutland Square Unit 1 is a home located in Suffolk County with nearby schools including Edward M. Kennedy Academy for Health Careers, Kingsley Montessori School, and Cathedral High School.
Ownership History
Date
Name
Owned For
Owner Type
Purchase Details
Closed on
May 3, 2021
Sold by
Babchak John E and Walsh Richard J
Bought by
John E Babchak 3Rd Ret
Current Estimated Value
Purchase Details
Closed on
May 1, 1998
Sold by
Ent Peter A
Bought by
Babchak John E and Walsh Richard J
Home Financials for this Owner
Home Financials are based on the most recent Mortgage that was taken out on this home.
Original Mortgage
$206,250
Interest Rate
7.04%
Mortgage Type
Purchase Money Mortgage
Purchase Details
Closed on
Aug 5, 1993
Sold by
Dennis Kevin M and Kellogg Rebecca
Bought by
Smith Roy G
Purchase Details
Closed on
Oct 26, 1987
Sold by
Dennis Kevin M
Bought by
Neubert Christopher J
Home Financials for this Owner
Home Financials are based on the most recent Mortgage that was taken out on this home.
Original Mortgage
$216,000
Interest Rate
10.92%
Mortgage Type
Purchase Money Mortgage
Create a Home Valuation Report for This Property
The Home Valuation Report is an in-depth analysis detailing your home's value as well as a comparison with similar homes in the area
Home Values in the Area
Average Home Value in this Area
Purchase History
| Date | Buyer | Sale Price | Title Company |
|---|---|---|---|
| John E Babchak 3Rd Ret | -- | None Available | |
| Babchak John E | $412,500 | -- | |
| Smith Roy G | $13,000 | -- | |
| Neubert Christopher J | $270,000 | -- |
Source: Public Records
Mortgage History
| Date | Status | Borrower | Loan Amount |
|---|---|---|---|
| Previous Owner | Neubert Christopher J | $261,800 | |
| Previous Owner | Neubert Christopher J | $265,000 | |
| Previous Owner | Neubert Christopher J | $206,250 | |
| Previous Owner | Neubert Christopher J | $216,000 |
Source: Public Records
Tax History Compared to Growth
Tax History
| Year | Tax Paid | Tax Assessment Tax Assessment Total Assessment is a certain percentage of the fair market value that is determined by local assessors to be the total taxable value of land and additions on the property. | Land | Improvement |
|---|---|---|---|---|
| 2025 | $15,713 | $1,356,900 | $0 | $1,356,900 |
| 2024 | $14,225 | $1,305,000 | $0 | $1,305,000 |
| 2023 | $13,601 | $1,266,400 | $0 | $1,266,400 |
| 2022 | $13,122 | $1,206,100 | $0 | $1,206,100 |
| 2021 | $12,869 | $1,206,100 | $0 | $1,206,100 |
| 2020 | $13,140 | $1,244,300 | $0 | $1,244,300 |
| 2019 | $12,240 | $1,161,300 | $0 | $1,161,300 |
| 2018 | $11,483 | $1,095,700 | $0 | $1,095,700 |
| 2017 | $10,951 | $1,034,100 | $0 | $1,034,100 |
| 2016 | $10,937 | $994,300 | $0 | $994,300 |
| 2015 | $10,893 | $899,500 | $0 | $899,500 |
| 2014 | $10,385 | $825,500 | $0 | $825,500 |
Source: Public Records
Map
Nearby Homes
- 15 Concord Square Unit A
- 12 Concord Square Unit 1
- 8 Rutland Square Unit 2
- 41 Rutland Square Unit 1
- 56 Rutland Square
- 144 Worcester St Unit 2
- 193 W Springfield St
- 221 W Springfield St Unit 3
- 75 Rutland St Unit 1
- 71 Rutland St Unit 4
- 202 W Springfield St Unit 3
- 668 Tremont St Unit 3
- 93 Pembroke St Unit 1
- 87 Pembroke St
- 128 Pembroke St Unit 2-3
- 771 Tremont St Unit 2
- 85 Pembroke St Unit 2
- 667 Tremont St Unit 3
- 667 Tremont St Unit 1
- 667 Tremont St Unit 4
- 16 Rutland Square Unit 4
- 16 Rutland Square Unit 3
- 16 Rutland Square Unit 2
- 14 Rutland Square
- 18 Rutland Square Unit B
- 18 Rutland Square
- 18 Rutland St Unit 6
- 18 Rutland Square Unit 1
- 18 Rutland Square Unit P
- 12 Rutland Square Unit 3
- 12 Rutland Square Unit 2
- 12 Rutland Square Unit 1
- 20 Rutland Square Unit 1
- 20 Rutland Square
- 10 Rutland Square Unit 2
- 10 Rutland Square Unit 1
- 10 Rutland Square
- 22 Rutland Square Unit 1
- 22 Rutland Square
- 24 Rutland Square