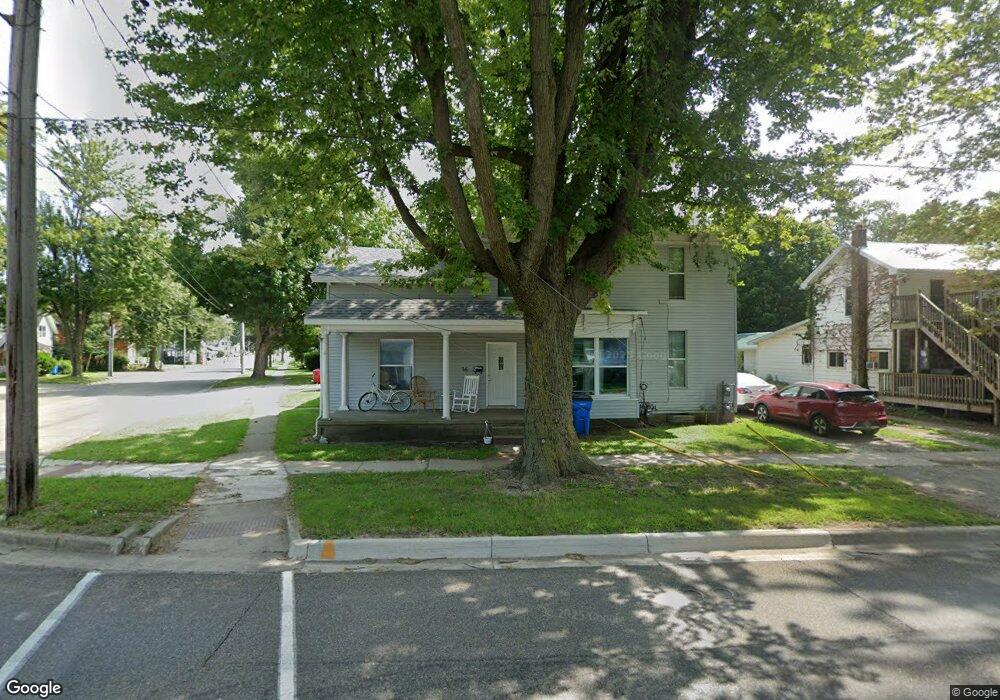
16 S Main St Quincy, MI 49082
Estimated Value: $141,727 - $172,000
About This Home
This home is located at 16 S Main St, Quincy, MI 49082 and is currently estimated at $157,182, approximately $77 per square foot. 16 S Main St is a home located in Branch County with nearby schools including Jennings Elementary School, Quincy Middle School, and Quincy High School.
Ownership History
We collect this data history from publicly available records. To have your information removed, we recommend requesting removal directly through your county’s website.
Purchase Details
Purchase Details
Purchase Details
Home Financials for this Owner
Home Financials are based on the most recent Mortgage that was taken out on this home.Purchase Details
Purchase Details
Purchase History
We collect this data history from publicly available records. To have your information removed, we recommend requesting removal directly through your county’s website.
| Date | Buyer | Sale Price | Title Company |
|---|---|---|---|
| -- | None Available | ||
| $33,150 | None Available | ||
| $53,000 | Branch County Abstract & Tit | ||
| $47,500 | -- | ||
| $31,000 | -- |
Mortgage History
We collect this data history from publicly available records. To have your information removed, we recommend requesting removal directly through your county’s website.
| Date | Status | Borrower | Loan Amount |
|---|---|---|---|
| Previous Owner | $47,700 |
Tax History
We collect this data history from publicly available records. To have your information removed, we recommend requesting removal directly through your county’s website.
| Year | Tax Paid | Tax Assessment Tax Assessment Total Assessment is a certain percentage of the fair market value that is determined by local assessors to be the total taxable value of land and additions on the property. | Land | Improvement |
|---|---|---|---|---|
| 2025 | $1,273 | $69,886 | $0 | $0 |
| 2024 | $6 | $63,371 | $0 | $0 |
| 2023 | $633 | $57,473 | $0 | $0 |
| 2022 | $633 | $53,128 | $0 | $0 |
| 2020 | -- | $51,403 | $0 | $0 |
| 2019 | -- | $42,239 | $0 | $0 |
| 2018 | -- | $38,346 | $0 | $0 |
| 2017 | -- | $37,342 | $0 | $0 |
| 2016 | -- | $31,728 | $0 | $0 |
| 2015 | -- | $32,940 | $0 | $0 |
| 2014 | -- | $31,357 | $0 | $0 |
| 2013 | -- | $31,862 | $0 | $0 |
Map
- 46 W Chicago St
- 5 Arnold St
- 52 W Chicago St
- 29 Broughton St
- 1012 Aguadero Pkwy Unit 30
- 493 Richard St
- 305 Ridge Rd
- 257 Edgewood Dr
- 0 Wildwood Rd
- 928 Hummingbird Ln
- 345 N Fremont Rd
- 118 N Ray Quincy Rd
- 721 Clarendon Rd
- 650 Boone Rd
- 833 Crauns Ln
- 00 Hog Creek Rd
- 147 Dons Dr
- VL N Fiske Rd
- 410 N Fiske Rd
- 181 Dons Dr
Ask me questions while you tour the home.