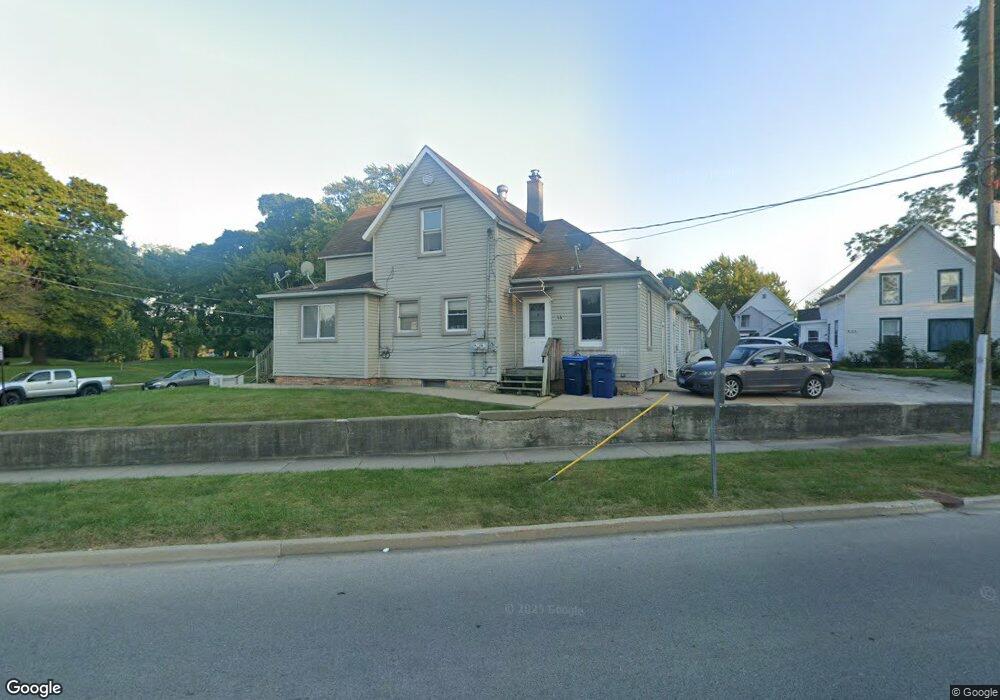
16 S Park Ave Waukegan, IL 60085
Downtown Waukegan NeighborhoodEstimated Value: $192,088 - $210,000
3
Beds
2
Baths
1,568
Sq Ft
$127/Sq Ft
Est. Value
About This Home
This home is located at 16 S Park Ave, Waukegan, IL 60085 and is currently estimated at $198,772, approximately $126 per square foot. 16 S Park Ave is a home located in Lake County with nearby schools including Robert E. Abbott Middle School, Waukegan High School, and Most Blessed Trinity Academy.
Ownership History
Date
Name
Owned For
Owner Type
Purchase Details
Closed on
Dec 6, 2006
Sold by
Easo Cheeramkula Thu K and Easo Saramma
Bought by
Dennison Steve
Current Estimated Value
Home Financials for this Owner
Home Financials are based on the most recent Mortgage that was taken out on this home.
Original Mortgage
$108,000
Outstanding Balance
$64,428
Interest Rate
6.27%
Mortgage Type
New Conventional
Estimated Equity
$134,344
Purchase Details
Closed on
Nov 26, 2002
Sold by
Salgado Esteban
Bought by
Easo Cheeramkula Thu K and Easo Saramma
Home Financials for this Owner
Home Financials are based on the most recent Mortgage that was taken out on this home.
Original Mortgage
$80,750
Interest Rate
9%
Purchase Details
Closed on
Jan 18, 1994
Sold by
American National Bank Of Libertyville
Bought by
Salgado Esteban
Create a Home Valuation Report for This Property
The Home Valuation Report is an in-depth analysis detailing your home's value as well as a comparison with similar homes in the area
Home Values in the Area
Average Home Value in this Area
Purchase History
| Date | Buyer | Sale Price | Title Company |
|---|---|---|---|
| Dennison Steve | $135,000 | None Available | |
| Easo Cheeramkula Thu K | $95,000 | First American Title Ins | |
| Salgado Esteban | $22,000 | -- |
Source: Public Records
Mortgage History
| Date | Status | Borrower | Loan Amount |
|---|---|---|---|
| Open | Dennison Steve | $108,000 | |
| Previous Owner | Easo Cheeramkula Thu K | $80,750 |
Source: Public Records
Tax History Compared to Growth
Tax History
| Year | Tax Paid | Tax Assessment Tax Assessment Total Assessment is a certain percentage of the fair market value that is determined by local assessors to be the total taxable value of land and additions on the property. | Land | Improvement |
|---|---|---|---|---|
| 2024 | $3,609 | $44,696 | $3,737 | $40,959 |
| 2023 | $3,046 | $38,276 | $3,200 | $35,076 |
| 2022 | $3,046 | $31,154 | $2,601 | $28,553 |
| 2021 | $2,563 | $24,583 | $2,171 | $22,412 |
| 2020 | $2,596 | $22,902 | $2,023 | $20,879 |
| 2019 | $2,613 | $20,986 | $1,854 | $19,132 |
| 2018 | $2,666 | $20,619 | $2,755 | $17,864 |
| 2017 | $2,595 | $18,242 | $2,437 | $15,805 |
| 2016 | $2,450 | $15,852 | $2,118 | $13,734 |
| 2015 | $2,397 | $14,188 | $1,896 | $12,292 |
| 2014 | $3,011 | $17,796 | $2,414 | $15,382 |
| 2012 | $3,731 | $19,279 | $2,615 | $16,664 |
Source: Public Records
Map
Nearby Homes
- 613 Washington St
- 557 W Water St
- 28 N Saint James St
- 610 Bluff St
- 215 S Park Ave
- 23 N Jackson St
- 613 Clarke Ave
- 304 Powell Ave
- 305 Besley Place
- 502 Belvidere Rd
- 408 Besley Place
- 426 Julian St
- 222 Grand Ave
- 1416 Hamilton Ct
- 452 North Ave
- 428 N Poplar St
- 511 Chestnut St
- 446 S Jackson St
- 1521 Catalpa Ave
- 522 George Ave
- 20 S Park Ave
- 22 S Park Ave
- 24 S Park Ave
- 609 Glen Rock Ave
- 26 S Park Ave
- 616 Glen Rock Ave
- 0 S Park Ave Unit 7001807
- 0 S Park Ave Unit 7230218
- 0 S Park Ave Unit 7576376
- 32 S Park Ave
- 604 W Water St
- 606 W Water St
- 613 Washington St Unit 2
- 613 Washington St Unit 4
- 613 Washington St Unit 1
- 613 Washington St Unit 3
- 617 Washington St
- 624 Glen Rock Ave
- 11 S Saint James St
- 25 S Saint James St