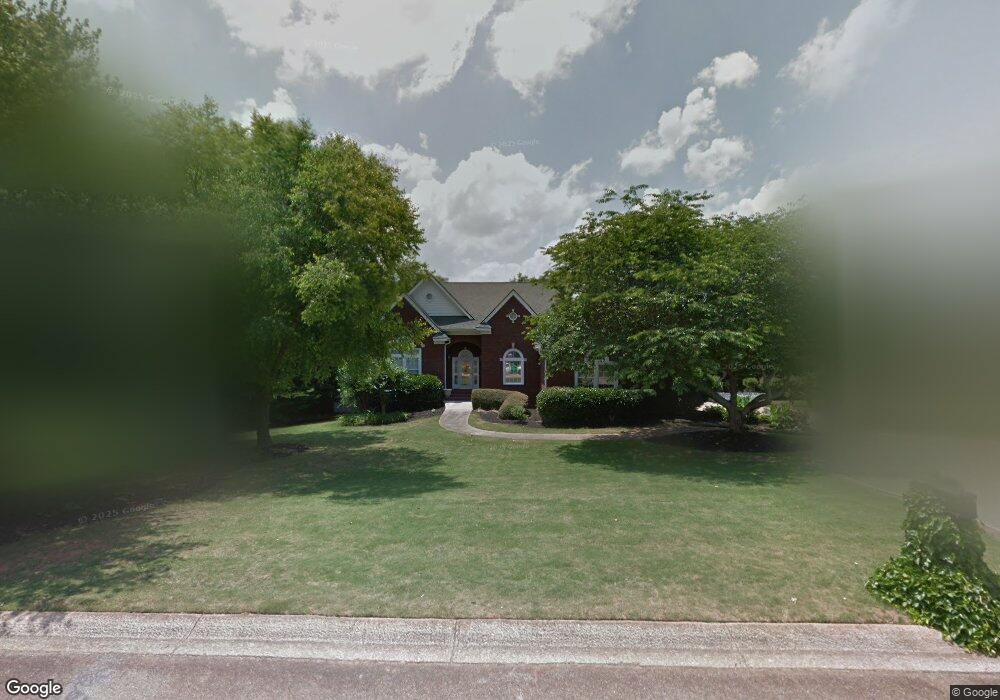
16 Saint Ives Way Winder, GA 30680
Estimated Value: $544,000 - $696,000
4
Beds
3
Baths
4,802
Sq Ft
$128/Sq Ft
Est. Value
About This Home
This home is located at 16 Saint Ives Way, Winder, GA 30680 and is currently estimated at $614,149, approximately $127 per square foot. 16 Saint Ives Way is a home located in Barrow County with nearby schools including Holsenbeck Elementary School, Bear Creek Middle School, and Winder-Barrow High School.
Ownership History
Date
Name
Owned For
Owner Type
Purchase Details
Closed on
Feb 10, 2017
Sold by
Oshields Karen Lovern
Bought by
Shepley Russell E and Shepley Erica P
Current Estimated Value
Home Financials for this Owner
Home Financials are based on the most recent Mortgage that was taken out on this home.
Original Mortgage
$318,725
Outstanding Balance
$213,006
Interest Rate
4.12%
Mortgage Type
New Conventional
Estimated Equity
$401,143
Purchase Details
Closed on
Nov 30, 2011
Sold by
Lovern William Brent
Bought by
Lovern Karen S
Purchase Details
Closed on
Jul 13, 2007
Sold by
Lovern Karen S
Bought by
Lovern Karen S and Brent Lovern W
Home Financials for this Owner
Home Financials are based on the most recent Mortgage that was taken out on this home.
Original Mortgage
$308,000
Interest Rate
6.52%
Mortgage Type
New Conventional
Purchase Details
Closed on
May 31, 1995
Sold by
Dahco Inc
Bought by
Lovern Karen
Create a Home Valuation Report for This Property
The Home Valuation Report is an in-depth analysis detailing your home's value as well as a comparison with similar homes in the area
Home Values in the Area
Average Home Value in this Area
Purchase History
| Date | Buyer | Sale Price | Title Company |
|---|---|---|---|
| Shepley Russell E | $335,500 | -- | |
| Lovern Karen S | -- | -- | |
| Lovern Karen S | -- | -- | |
| Lovern Karen | $240,000 | -- |
Source: Public Records
Mortgage History
| Date | Status | Borrower | Loan Amount |
|---|---|---|---|
| Open | Shepley Russell E | $318,725 | |
| Previous Owner | Lovern Karen S | $308,000 | |
| Closed | Lovern Karen | $0 |
Source: Public Records
Tax History Compared to Growth
Tax History
| Year | Tax Paid | Tax Assessment Tax Assessment Total Assessment is a certain percentage of the fair market value that is determined by local assessors to be the total taxable value of land and additions on the property. | Land | Improvement |
|---|---|---|---|---|
| 2024 | $6,050 | $219,060 | $33,200 | $185,860 |
| 2023 | $5,556 | $219,060 | $33,200 | $185,860 |
| 2022 | $5,132 | $156,888 | $33,200 | $123,688 |
| 2021 | $4,999 | $145,688 | $22,000 | $123,688 |
| 2020 | $4,767 | $145,688 | $22,000 | $123,688 |
| 2019 | $4,631 | $139,554 | $22,000 | $117,554 |
| 2018 | $4,544 | $133,419 | $22,000 | $111,419 |
| 2017 | $3,169 | $106,230 | $22,000 | $84,230 |
| 2016 | $3,457 | $103,130 | $22,000 | $81,130 |
| 2015 | $3,492 | $104,066 | $22,000 | $82,066 |
| 2014 | $3,323 | $98,361 | $10,780 | $87,581 |
| 2013 | -- | $96,148 | $10,780 | $85,368 |
Source: Public Records
Map
Nearby Homes
- 16 Saint Ives Way Unit 1
- 16 St Ives Way
- 14 Saint Ives Way
- 18 Saint Ives Way
- 22 Saint Ives Cir
- 12 Saint Ives Way
- 24 Saint Ives Cir
- 1 Saint Ives Ct
- 1 Saint Ives Cir
- 12 Saint Ives Ct
- 12 Saint Ives Ct Unit 1
- 26 Saint Ives Cir
- 20 Saint Ives Way
- 10 Saint Ives Way
- 1 St Ives Ct
- 23 Saint Ives Cir Unit 2
- 21 Saint Ives Ln Unit 1/16
- 21 Saint Ives Ln
- 21 Saint Ives Ln Unit 1
- 14 Saint Ives Ct Unit 1