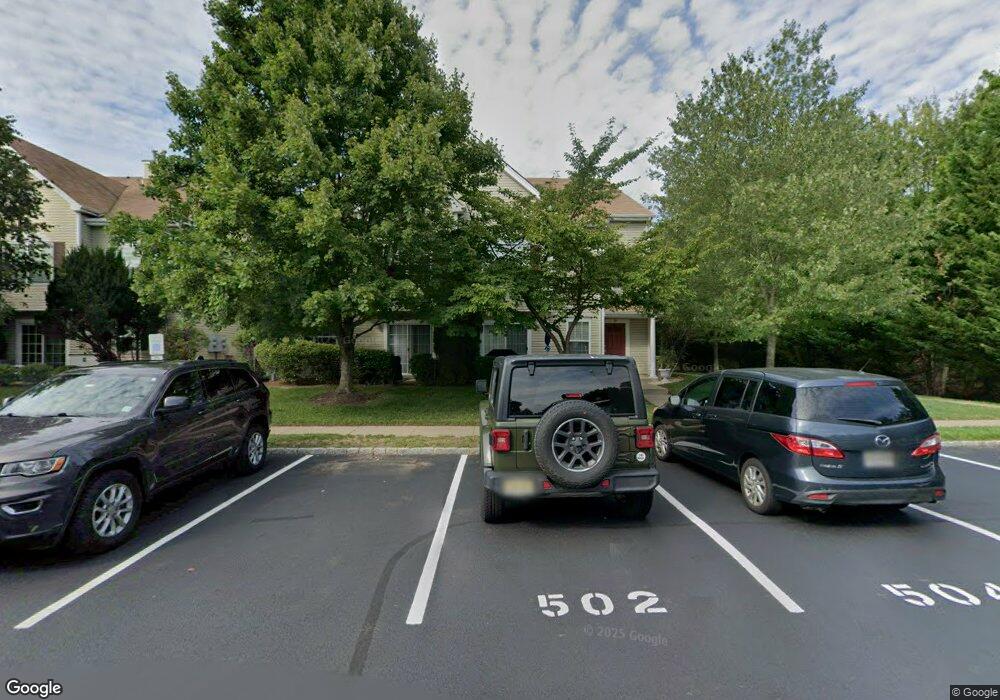
16 Saint Paul Ct Unit 8 Tinton Falls, NJ 07712
Estimated Value: $548,187 - $585,000
3
Beds
3
Baths
1,998
Sq Ft
$284/Sq Ft
Est. Value
About This Home
This home is located at 16 Saint Paul Ct Unit 8, Tinton Falls, NJ 07712 and is currently estimated at $567,297, approximately $283 per square foot. 16 Saint Paul Ct Unit 8 is a home located in Monmouth County with nearby schools including Mahala F. Atchinson Elementary School, Swimming River Elementary School, and Tinton Falls Middle School.
Ownership History
Date
Name
Owned For
Owner Type
Purchase Details
Closed on
Nov 20, 2008
Sold by
Homesales Inc
Bought by
Villa Jennifer
Current Estimated Value
Home Financials for this Owner
Home Financials are based on the most recent Mortgage that was taken out on this home.
Original Mortgage
$274,623
Outstanding Balance
$183,709
Interest Rate
6.47%
Mortgage Type
FHA
Estimated Equity
$383,588
Purchase Details
Closed on
Jan 28, 2005
Sold by
Hovbilt Inc
Bought by
Zaburyanna Iryna
Home Financials for this Owner
Home Financials are based on the most recent Mortgage that was taken out on this home.
Original Mortgage
$236,488
Interest Rate
5.73%
Mortgage Type
Future Advance Clause Open End Mortgage
Create a Home Valuation Report for This Property
The Home Valuation Report is an in-depth analysis detailing your home's value as well as a comparison with similar homes in the area
Home Values in the Area
Average Home Value in this Area
Purchase History
| Date | Buyer | Sale Price | Title Company |
|---|---|---|---|
| Villa Jennifer | $289,900 | Multiple | |
| Zaburyanna Iryna | $295,610 | -- |
Source: Public Records
Mortgage History
| Date | Status | Borrower | Loan Amount |
|---|---|---|---|
| Open | Villa Jennifer | $274,623 | |
| Previous Owner | Zaburyanna Iryna | $236,488 |
Source: Public Records
Tax History Compared to Growth
Tax History
| Year | Tax Paid | Tax Assessment Tax Assessment Total Assessment is a certain percentage of the fair market value that is determined by local assessors to be the total taxable value of land and additions on the property. | Land | Improvement |
|---|---|---|---|---|
| 2025 | $7,090 | $505,800 | $237,500 | $268,300 |
| 2024 | $6,687 | $492,700 | $227,500 | $265,200 |
| 2023 | $6,687 | $438,200 | $175,000 | $263,200 |
| 2022 | $6,265 | $386,300 | $130,000 | $256,300 |
| 2021 | $6,259 | $325,300 | $110,000 | $215,300 |
| 2020 | $6,442 | $322,900 | $110,000 | $212,900 |
| 2019 | $6,259 | $314,200 | $100,000 | $214,200 |
| 2018 | $6,232 | $311,900 | $100,000 | $211,900 |
| 2017 | $6,202 | $302,700 | $95,000 | $207,700 |
| 2016 | $6,179 | $294,800 | $90,000 | $204,800 |
| 2015 | $6,038 | $291,700 | $90,000 | $201,700 |
| 2014 | $6,137 | $283,600 | $70,000 | $213,600 |
Source: Public Records
Map
Nearby Homes
- 11 Madison Ct
- 2 Madison Ct
- 43 Richmond Ct
- 58 Madison Ct
- 9 Des Moines Ct
- 32 Dover Ct
- 18 Kyle Dr
- 51 Phoenix Ct
- 74 Kyle Dr
- 22 Jake Dr
- 4 Magnolia Ct
- 2 Pelican Ct
- 1218 W Park Ave
- 11 Rolling Meadows Blvd S
- 89 Austin St
- 16 Rolling Meadows Blvd S
- 106 Rolling Meadows Blvd S
- 102 Rolling Meadows Blvd S
- 87 Diane Dr
- 16 Karen Dr
- 14 St Paul Ct
- 14 Saint Paul Ct
- 15 Saint Paul Ct
- 13 Saint Paul Ct Unit 5
- 12 Saint Paul Ct
- 11 Saint Paul Ct Unit 3
- 10 Saint Paul Ct
- 9 Saint Paul Ct
- 8 Saint Paul Ct
- 7 Saint Paul Ct
- 6 Saint Paul Ct Unit 6
- 26 Saint Paul Ct
- 5 Saint Paul Ct
- 26 St Paul Ct
- 25 Saint Paul Ct
- 28 Saint Paul Ct
- 4 Saint Paul Ct
- 27 Saint Paul Ct
- 3 Saint Paul Ct
- 30 Saint Paul Ct