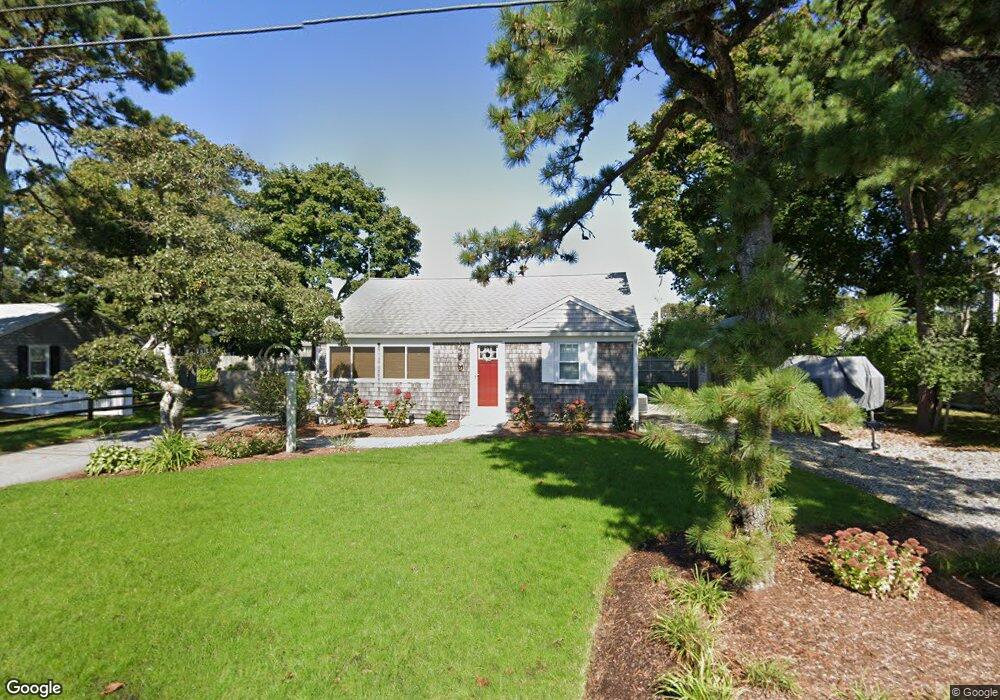
16 Santucket Rd West Dennis, MA 02670
West Dennis NeighborhoodEstimated Value: $556,000 - $689,850
2
Beds
1
Bath
800
Sq Ft
$803/Sq Ft
Est. Value
About This Home
This home is located at 16 Santucket Rd, West Dennis, MA 02670 and is currently estimated at $642,213, approximately $802 per square foot. 16 Santucket Rd is a home located in Barnstable County with nearby schools including Dennis-Yarmouth Regional High School and St. Pius X. School.
Ownership History
Date
Name
Owned For
Owner Type
Purchase Details
Closed on
Jun 10, 2016
Sold by
Owings Sue A
Bought by
Macdonald Lee R and Macdonald Debra A
Current Estimated Value
Home Financials for this Owner
Home Financials are based on the most recent Mortgage that was taken out on this home.
Original Mortgage
$168,000
Outstanding Balance
$134,100
Interest Rate
3.66%
Mortgage Type
New Conventional
Estimated Equity
$508,113
Purchase Details
Closed on
May 1, 2003
Sold by
Tht T and Terrio Thomas H
Bought by
Eisenstein James S and Eisenstein Elizabeth A
Home Financials for this Owner
Home Financials are based on the most recent Mortgage that was taken out on this home.
Original Mortgage
$300,000
Interest Rate
5.82%
Mortgage Type
Purchase Money Mortgage
Purchase Details
Closed on
May 19, 1997
Sold by
Dedousis Nancy A
Bought by
Owings Sue A
Create a Home Valuation Report for This Property
The Home Valuation Report is an in-depth analysis detailing your home's value as well as a comparison with similar homes in the area
Home Values in the Area
Average Home Value in this Area
Purchase History
| Date | Buyer | Sale Price | Title Company |
|---|---|---|---|
| Macdonald Lee R | $210,000 | -- | |
| Eisenstein James S | $840,000 | -- | |
| Owings Sue A | $117,500 | -- |
Source: Public Records
Mortgage History
| Date | Status | Borrower | Loan Amount |
|---|---|---|---|
| Open | Macdonald Lee R | $168,000 | |
| Previous Owner | Owings Sue A | $300,000 |
Source: Public Records
Tax History Compared to Growth
Tax History
| Year | Tax Paid | Tax Assessment Tax Assessment Total Assessment is a certain percentage of the fair market value that is determined by local assessors to be the total taxable value of land and additions on the property. | Land | Improvement |
|---|---|---|---|---|
| 2025 | $3,085 | $712,400 | $386,600 | $325,800 |
| 2024 | $2,628 | $598,700 | $309,800 | $288,900 |
| 2023 | $2,429 | $520,100 | $281,700 | $238,400 |
| 2022 | $2,414 | $431,000 | $253,700 | $177,300 |
| 2021 | $2,301 | $381,600 | $248,800 | $132,800 |
| 2020 | $2,422 | $397,000 | $276,400 | $120,600 |
| 2019 | $2,343 | $379,800 | $271,000 | $108,800 |
| 2018 | $2,100 | $331,300 | $232,200 | $99,100 |
| 2017 | $2,227 | $323,200 | $232,200 | $91,000 |
| 2016 | $2,052 | $314,300 | $237,300 | $77,000 |
| 2015 | $2,012 | $314,300 | $237,300 | $77,000 |
| 2014 | $1,865 | $293,700 | $216,700 | $77,000 |
Source: Public Records
Map
Nearby Homes
- 2 Rita Mary Way
- 14 Schoolhouse Ln
- 209 Main St Unit 3
- 209 Main St Unit 6
- 209 Main St Unit 1
- 209 Main St Unit 2
- 209 Main St Unit 4
- 209 Main St Unit 5
- 178 School St
- 23 Doric Ave
- 308 Old Main St
- 181 Pleasant St
- 401 Main St Unit 201
- 401 Main St Unit 101
- 45 Seth Ln
- 40 Kelley Rd
- 467 Main St
- 29 Bass River Rd
- 22 Powhatan Rd
- 18 Turner Ln