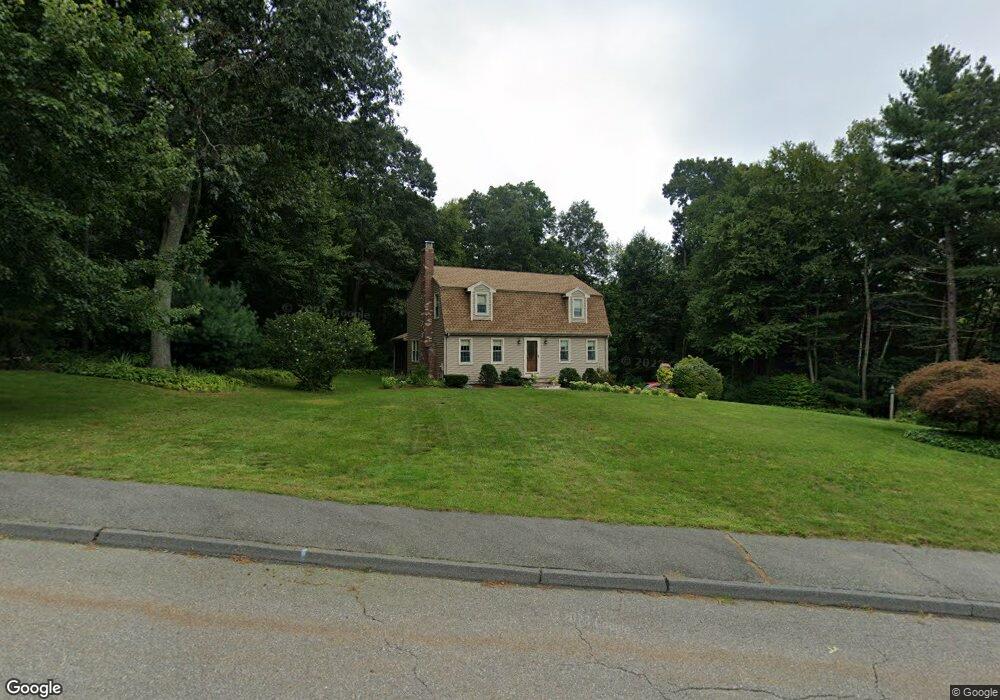
16 Saratoga Dr Uxbridge, MA 01569
Estimated Value: $585,000 - $705,000
4
Beds
3
Baths
2,656
Sq Ft
$234/Sq Ft
Est. Value
About This Home
This home is located at 16 Saratoga Dr, Uxbridge, MA 01569 and is currently estimated at $621,943, approximately $234 per square foot. 16 Saratoga Dr is a home located in Worcester County with nearby schools including Uxbridge High School and Our Lady of the Valley Regional School.
Ownership History
Date
Name
Owned For
Owner Type
Purchase Details
Closed on
Mar 2, 2015
Sold by
Alberta Michael A and Alberta Christine
Bought by
Alberta Michael A and Alberta Christine
Current Estimated Value
Purchase Details
Closed on
Sep 6, 1994
Sold by
Hardiman Jeffrey J and Hardiman Cheryl
Bought by
Alberta Michael and Alberta Christine
Home Financials for this Owner
Home Financials are based on the most recent Mortgage that was taken out on this home.
Original Mortgage
$83,000
Interest Rate
8.44%
Mortgage Type
Purchase Money Mortgage
Purchase Details
Closed on
Feb 1, 1993
Sold by
Afco Land & Dev Corp
Bought by
Hardiman Jeffrey J and Hardiman Cheryl
Home Financials for this Owner
Home Financials are based on the most recent Mortgage that was taken out on this home.
Original Mortgage
$122,861
Interest Rate
8.16%
Mortgage Type
Purchase Money Mortgage
Create a Home Valuation Report for This Property
The Home Valuation Report is an in-depth analysis detailing your home's value as well as a comparison with similar homes in the area
Home Values in the Area
Average Home Value in this Area
Purchase History
| Date | Buyer | Sale Price | Title Company |
|---|---|---|---|
| Alberta Michael A | -- | -- | |
| Alberta Michael | $155,000 | -- | |
| Hardiman Jeffrey J | $132,600 | -- |
Source: Public Records
Mortgage History
| Date | Status | Borrower | Loan Amount |
|---|---|---|---|
| Previous Owner | Hardiman Jeffrey J | $67,150 | |
| Previous Owner | Hardiman Jeffrey J | $83,000 | |
| Previous Owner | Hardiman Jeffrey J | $123,000 | |
| Previous Owner | Hardiman Jeffrey J | $122,861 |
Source: Public Records
Tax History
| Year | Tax Paid | Tax Assessment Tax Assessment Total Assessment is a certain percentage of the fair market value that is determined by local assessors to be the total taxable value of land and additions on the property. | Land | Improvement |
|---|---|---|---|---|
| 2025 | $54 | $413,000 | $145,300 | $267,700 |
| 2024 | $5,123 | $396,500 | $137,800 | $258,700 |
| 2023 | $4,860 | $348,400 | $119,200 | $229,200 |
| 2022 | $4,392 | $289,700 | $104,300 | $185,400 |
| 2021 | $4,583 | $289,700 | $104,300 | $185,400 |
| 2020 | $4,943 | $295,300 | $100,600 | $194,700 |
| 2019 | $4,938 | $284,600 | $100,600 | $184,000 |
| 2018 | $4,624 | $269,300 | $105,900 | $163,400 |
| 2017 | $4,649 | $274,100 | $124,100 | $150,000 |
| 2016 | $4,082 | $232,300 | $95,000 | $137,300 |
| 2015 | $3,995 | $229,600 | $95,000 | $134,600 |
Source: Public Records
Map
Nearby Homes
- 57 Kempton Rd
- 51 Albee Rd
- 90 Chestnut Hill Rd
- 127 Old Millville Rd
- 179 Thayer St
- 18 Chestnut Hill Rd
- 12 Hickory Rd
- 16 Preston St
- 53 Asylum St
- 70 Chocolog Rd
- 220 Millville Rd
- 300 Crownshield Ave
- 314 Richardson St
- 13A Asylum St
- 73 Tea Party Dr Unit L-4
- 111 Cider Mill Rd
- 7 Gentry Ln Unit 7
- 197 Crownshield Ave Unit 16C
- 183-183R Mendon St
- 37 Elizabeth St
- 38 Saratoga Dr
- 23 Waucantuck Dr
- 17 Saratoga Dr
- 33 Waucantuck Dr
- 35 Saratoga Dr
- 13 Saratoga Dr
- 48 Saratoga Dr
- 48 Saratoga Dr Unit 48
- 20 Waucantuck Dr
- 43 Waucantuck Dr
- 49 Saratoga Dr
- 434 East St
- 446 East St
- 16 Sequoia Ln
- 4 Waucantuck Dr
- 58 Saratoga Dr
- 53 Waucantuck Dr
- 42 Waucantuck Dr
- 452 East St
- 59 Saratoga Dr