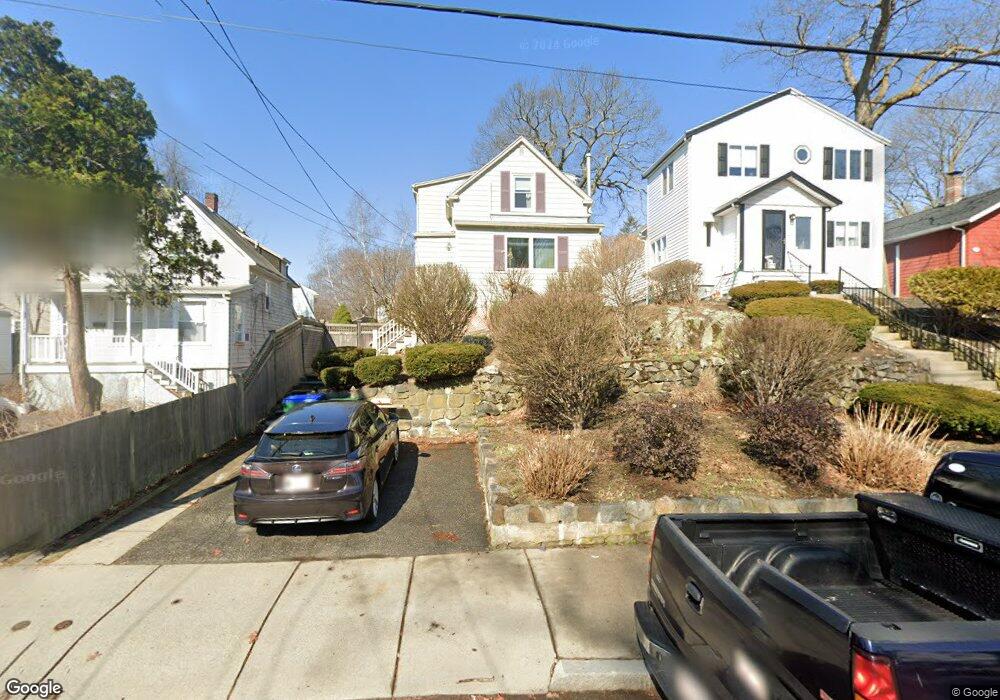
16 Saunders St Medford, MA 02155
North Medford NeighborhoodEstimated Value: $620,000 - $698,000
3
Beds
2
Baths
1,056
Sq Ft
$638/Sq Ft
Est. Value
About This Home
This home is located at 16 Saunders St, Medford, MA 02155 and is currently estimated at $674,011, approximately $638 per square foot. 16 Saunders St is a home located in Middlesex County with nearby schools including Medford High School, Mystic Valley Regional Charter School, and St. Joseph School.
Ownership History
Date
Name
Owned For
Owner Type
Purchase Details
Closed on
Mar 30, 2020
Sold by
Trudell Joan M
Bought by
Joan M Trudell Ret
Current Estimated Value
Purchase Details
Closed on
Aug 21, 1992
Sold by
Herra Emmalea L
Bought by
Trudell Joan M
Home Financials for this Owner
Home Financials are based on the most recent Mortgage that was taken out on this home.
Original Mortgage
$105,600
Interest Rate
8.12%
Mortgage Type
Purchase Money Mortgage
Create a Home Valuation Report for This Property
The Home Valuation Report is an in-depth analysis detailing your home's value as well as a comparison with similar homes in the area
Home Values in the Area
Average Home Value in this Area
Purchase History
| Date | Buyer | Sale Price | Title Company |
|---|---|---|---|
| Joan M Trudell Ret | -- | None Available | |
| Trudell Joan M | $132,000 | -- |
Source: Public Records
Mortgage History
| Date | Status | Borrower | Loan Amount |
|---|---|---|---|
| Previous Owner | Trudell Joan M | $105,600 |
Source: Public Records
Tax History Compared to Growth
Tax History
| Year | Tax Paid | Tax Assessment Tax Assessment Total Assessment is a certain percentage of the fair market value that is determined by local assessors to be the total taxable value of land and additions on the property. | Land | Improvement |
|---|---|---|---|---|
| 2025 | $4,652 | $546,000 | $287,100 | $258,900 |
| 2024 | $4,652 | $546,000 | $287,100 | $258,900 |
| 2023 | $4,477 | $517,600 | $268,300 | $249,300 |
| 2022 | $4,174 | $463,300 | $243,900 | $219,400 |
| 2021 | $4,151 | $441,100 | $232,300 | $208,800 |
| 2020 | $4,085 | $445,000 | $232,300 | $212,700 |
| 2019 | $3,930 | $409,400 | $211,200 | $198,200 |
| 2018 | $3,700 | $361,300 | $192,000 | $169,300 |
| 2017 | $3,504 | $331,800 | $179,400 | $152,400 |
| 2016 | $3,374 | $301,500 | $163,100 | $138,400 |
| 2015 | $3,323 | $284,000 | $155,400 | $128,600 |
Source: Public Records
Map
Nearby Homes