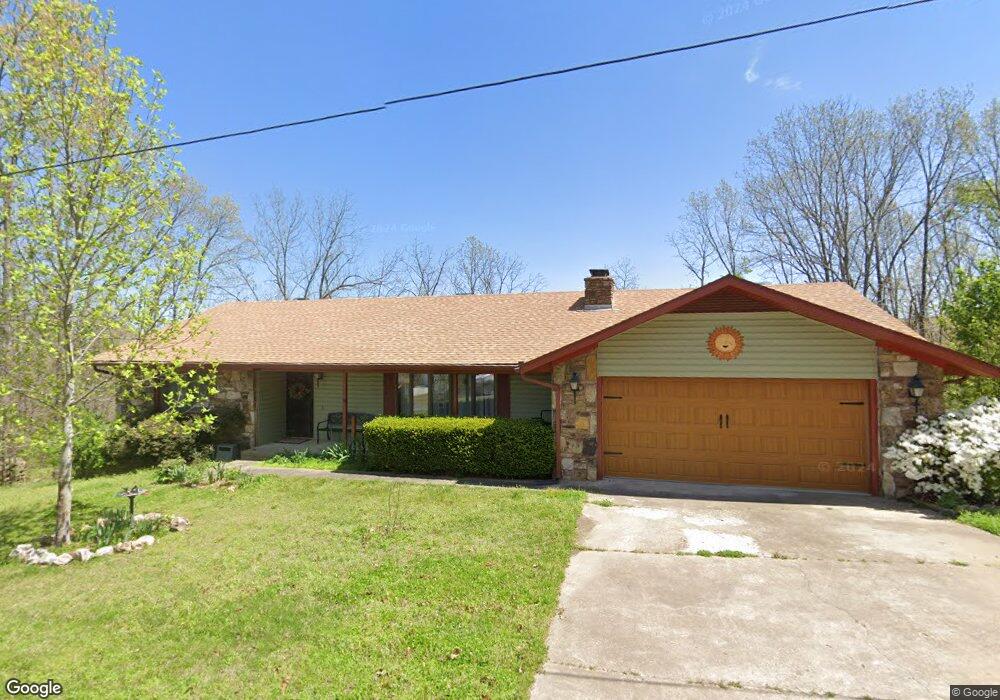
16 Scalloway Cir Bella Vista, AR 72715
Estimated Value: $362,000 - $542,000
3
Beds
2
Baths
1,250
Sq Ft
$349/Sq Ft
Est. Value
About This Home
This home is located at 16 Scalloway Cir, Bella Vista, AR 72715 and is currently estimated at $436,475, approximately $349 per square foot. 16 Scalloway Cir is a home located in Benton County with nearby schools including Glenn Duffy Elementary School, Gravette Upper Elementary School, and Gravette Middle School.
Ownership History
Date
Name
Owned For
Owner Type
Purchase Details
Closed on
May 21, 2008
Sold by
Dees Erik S and Dees Kristy
Bought by
Renfro Stephen Lee and Renfro Irene Pauline
Current Estimated Value
Home Financials for this Owner
Home Financials are based on the most recent Mortgage that was taken out on this home.
Original Mortgage
$134,900
Outstanding Balance
$86,277
Interest Rate
6.07%
Mortgage Type
Purchase Money Mortgage
Estimated Equity
$350,198
Purchase Details
Closed on
May 29, 2003
Bought by
Dees
Purchase Details
Closed on
Jun 17, 2002
Bought by
Gleaves
Purchase Details
Closed on
Mar 3, 2001
Bought by
Dod 03-03-2001
Purchase Details
Closed on
May 21, 1991
Bought by
Courtright Tr
Purchase Details
Closed on
Jan 28, 1985
Bought by
Courtright
Purchase Details
Closed on
May 11, 1984
Bought by
Cci
Purchase Details
Closed on
Feb 29, 1984
Bought by
Hughes
Create a Home Valuation Report for This Property
The Home Valuation Report is an in-depth analysis detailing your home's value as well as a comparison with similar homes in the area
Home Values in the Area
Average Home Value in this Area
Purchase History
| Date | Buyer | Sale Price | Title Company |
|---|---|---|---|
| Renfro Stephen Lee | $142,000 | Trust Title Company | |
| Dees | $150,000 | -- | |
| Gleaves | $140,000 | -- | |
| Dod 03-03-2001 | -- | -- | |
| Courtright Tr | -- | -- | |
| Courtright | $14,000 | -- | |
| Cci | $2,000 | -- | |
| Hughes | $15,000 | -- |
Source: Public Records
Mortgage History
| Date | Status | Borrower | Loan Amount |
|---|---|---|---|
| Open | Renfro Stephen Lee | $134,900 |
Source: Public Records
Tax History Compared to Growth
Tax History
| Year | Tax Paid | Tax Assessment Tax Assessment Total Assessment is a certain percentage of the fair market value that is determined by local assessors to be the total taxable value of land and additions on the property. | Land | Improvement |
|---|---|---|---|---|
| 2025 | $3,092 | $84,095 | $1,600 | $82,495 |
| 2024 | $2,721 | $84,095 | $1,600 | $82,495 |
| 2023 | $2,474 | $50,177 | $800 | $49,377 |
| 2022 | $2,621 | $50,177 | $800 | $49,377 |
| 2021 | $1,577 | $48,200 | $800 | $47,400 |
| 2020 | $1,492 | $35,700 | $600 | $35,100 |
| 2019 | $1,492 | $35,700 | $600 | $35,100 |
| 2018 | $1,517 | $35,700 | $600 | $35,100 |
| 2017 | $1,410 | $35,700 | $600 | $35,100 |
| 2016 | $1,410 | $35,700 | $600 | $35,100 |
| 2015 | $1,677 | $34,730 | $1,000 | $33,730 |
| 2014 | $1,677 | $34,730 | $1,000 | $33,730 |
Source: Public Records
Map
Nearby Homes
- 2 Scalloway Cir
- Lots 17 & 18 Scalloway Dr
- 0 Scalloway Cir
- Lot 6 Scalloway Dr
- 17 Sable Dr
- Lot 3 Blk 5 Sable Dr
- 1 Shotliff Cir
- 0 Sherlock Dr
- 31 Cullen Hills Dr
- TBD Shotliff Cir
- 0 Shotliff Cir
- 20 Singleton Dr
- 21 Singleton Dr
- 6 Campbell Ln
- 4 Skelton Dr
- 50 May Ln
- 19 Cullen Hills Dr
- 17 Cullen Hills Dr
- 94 Sherlock Dr
- 44 Sandwick Dr
- 14 Scalloway Cir
- 16 Scalloway Cir
- - Scalloway Cir
- -- Scalloway Cir
- 10 Scalloway Cir
- 11 Scalloway Cir
- 1103 Scalloway Dr
- 1610 Scalloway Dr
- 930 Scalloway Dr
- Lot 2 Scalloway Dr
- Lot 19 Scalloway Dr
- 20 Scalloway Cir
- 2303 Scalloway Cir
- 239 Scalloway Cir
- 529 Scalloway Cir
- 2030 Scalloway Cir
- 2990 Scalloway
- 0 Scalloway Dr Unit 470136
- 0 Scalloway Dr Unit 391086
- 0 Scalloway Dr Unit 426897