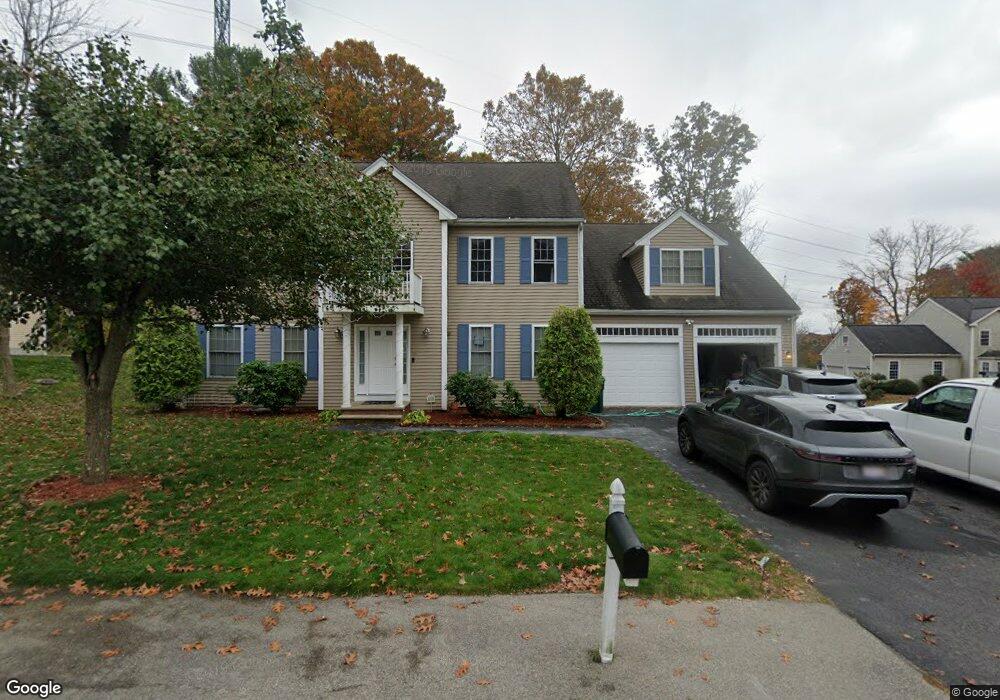
16 Scott St Holbrook, MA 02343
Estimated Value: $821,000 - $856,000
4
Beds
4
Baths
2,632
Sq Ft
$317/Sq Ft
Est. Value
About This Home
This home is located at 16 Scott St, Holbrook, MA 02343 and is currently estimated at $835,645, approximately $317 per square foot. 16 Scott St is a home located in Norfolk County with nearby schools including John F. Kennedy Elementary School, Holbrook Middle High School, and Boston Higashi School.
Ownership History
Date
Name
Owned For
Owner Type
Purchase Details
Closed on
Apr 26, 2004
Sold by
Gioioso Dev Llc
Bought by
Kakileti Kishore K and Kakileti Saraswathi
Current Estimated Value
Home Financials for this Owner
Home Financials are based on the most recent Mortgage that was taken out on this home.
Original Mortgage
$408,000
Outstanding Balance
$189,947
Interest Rate
5.4%
Mortgage Type
Purchase Money Mortgage
Estimated Equity
$645,698
Create a Home Valuation Report for This Property
The Home Valuation Report is an in-depth analysis detailing your home's value as well as a comparison with similar homes in the area
Home Values in the Area
Average Home Value in this Area
Purchase History
| Date | Buyer | Sale Price | Title Company |
|---|---|---|---|
| Kakileti Kishore K | $510,000 | -- | |
| Kakileti Kishore K | $510,000 | -- |
Source: Public Records
Mortgage History
| Date | Status | Borrower | Loan Amount |
|---|---|---|---|
| Open | Kakileti Kishore K | $408,000 | |
| Closed | Kakileti Kishore K | $408,000 |
Source: Public Records
Tax History
| Year | Tax Paid | Tax Assessment Tax Assessment Total Assessment is a certain percentage of the fair market value that is determined by local assessors to be the total taxable value of land and additions on the property. | Land | Improvement |
|---|---|---|---|---|
| 2025 | $102 | $770,300 | $280,500 | $489,800 |
| 2024 | $10,015 | $745,200 | $263,400 | $481,800 |
| 2023 | $10,066 | $654,500 | $232,000 | $422,500 |
| 2022 | $9,503 | $576,300 | $201,700 | $374,600 |
| 2021 | $9,456 | $549,100 | $188,600 | $360,500 |
| 2020 | $9,828 | $535,000 | $183,000 | $352,000 |
| 2019 | $9,876 | $507,500 | $171,100 | $336,400 |
| 2018 | $10,215 | $494,200 | $166,200 | $328,000 |
| 2017 | $9,792 | $468,500 | $151,800 | $316,700 |
| 2016 | $8,003 | $407,500 | $119,400 | $288,100 |
| 2015 | $7,382 | $386,900 | $114,600 | $272,300 |
| 2014 | $7,063 | $376,300 | $114,600 | $261,700 |
Source: Public Records
Map
Nearby Homes
- 120 Roberts Ave
- 229 Mill St
- 5 Clarendon Cir Unit Lot 4
- 217 Mill St
- 327 Union St
- 27 Winter St
- 36 Summer St
- 314 South St
- 278 N Franklin St
- 5 Patterson Ave E
- 8 Dianthus Rd
- 276 Center St
- 23 Nightingale Cir
- 123-125 N Franklin St
- 4 Evan Cain Way
- 58 Chandler St
- 19 Cochato Park
- 8 Plain St
- 7 Van Beal Rd
- 6 Eagle Rd
- 16 Scott St Unit 1
- 20 Scott St
- 12 Scott St
- 19 Scott St
- 23 Scott St
- 15 Scott St
- 155 Centre St
- 27 Scott St
- 11 Scott St
- 7 Mount Pleasant Ave
- 6 Scott St
- 151 Centre St
- 11 Mount Pleasant Ave
- 147 Centre St
- 150 Centre St
- 27 Worcester Place
- 15 Mount Pleasant Ave
- 4 Mount Pleasant Ave
- 102 Roberts Ave
- 171 Centre St
Your Personal Tour Guide
Ask me questions while you tour the home.