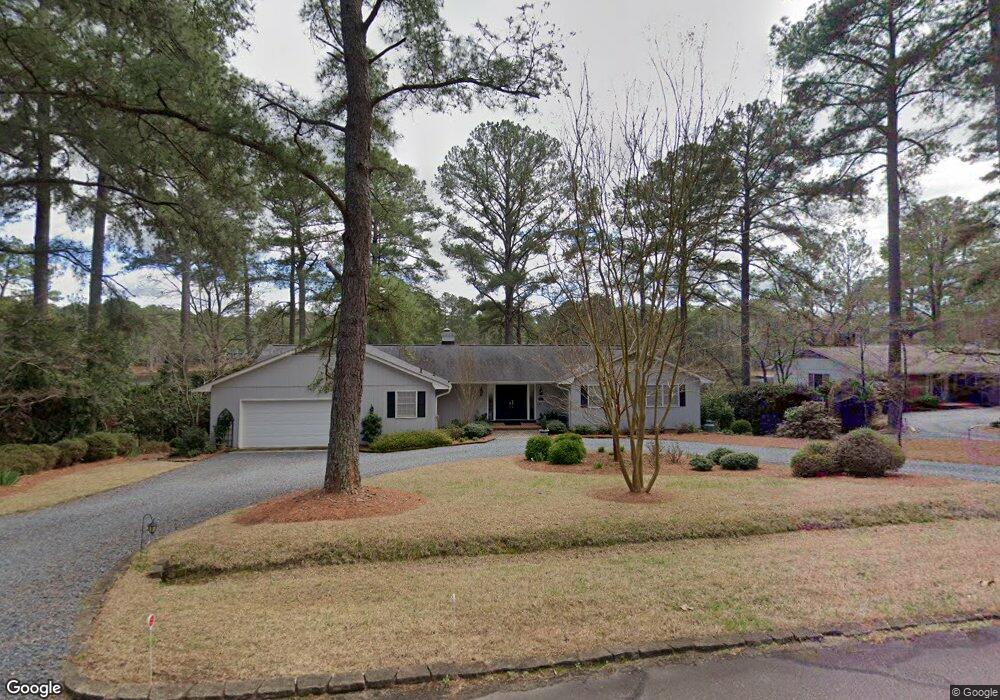
16 Shadow Ln Whispering Pines, NC 28327
Estimated Value: $545,000 - $643,000
3
Beds
4
Baths
2,718
Sq Ft
$218/Sq Ft
Est. Value
About This Home
This home is located at 16 Shadow Ln, Whispering Pines, NC 28327 and is currently estimated at $593,140, approximately $218 per square foot. 16 Shadow Ln is a home located in Moore County with nearby schools including McDeeds Creek Elementary School, New Century Middle School, and Union Pines High School.
Ownership History
Date
Name
Owned For
Owner Type
Purchase Details
Closed on
Jul 18, 2005
Sold by
Prudential Residential Services Lp
Bought by
Oriet William Michael and Oriet Susan D
Current Estimated Value
Home Financials for this Owner
Home Financials are based on the most recent Mortgage that was taken out on this home.
Original Mortgage
$236,000
Outstanding Balance
$117,890
Interest Rate
5.59%
Mortgage Type
Fannie Mae Freddie Mac
Estimated Equity
$475,250
Purchase Details
Closed on
May 24, 2005
Sold by
Bynum Pamela S
Bought by
Prudential Residential Services Lp and Prudential Homes Corp
Home Financials for this Owner
Home Financials are based on the most recent Mortgage that was taken out on this home.
Original Mortgage
$236,000
Outstanding Balance
$117,890
Interest Rate
5.59%
Mortgage Type
Fannie Mae Freddie Mac
Estimated Equity
$475,250
Purchase Details
Closed on
Sep 29, 2003
Sold by
Bynum Pamela S
Bought by
Oriet William Michael and Oriet Susan D
Create a Home Valuation Report for This Property
The Home Valuation Report is an in-depth analysis detailing your home's value as well as a comparison with similar homes in the area
Home Values in the Area
Average Home Value in this Area
Purchase History
| Date | Buyer | Sale Price | Title Company |
|---|---|---|---|
| Oriet William Michael | $295,000 | None Available | |
| Prudential Residential Services Lp | $295,000 | None Available | |
| Oriet William Michael | $265,000 | -- |
Source: Public Records
Mortgage History
| Date | Status | Borrower | Loan Amount |
|---|---|---|---|
| Open | Oriet William Michael | $236,000 | |
| Previous Owner | Prudential Residential Services Lp | $59,000 |
Source: Public Records
Tax History
| Year | Tax Paid | Tax Assessment Tax Assessment Total Assessment is a certain percentage of the fair market value that is determined by local assessors to be the total taxable value of land and additions on the property. | Land | Improvement |
|---|---|---|---|---|
| 2025 | $3,814 | $542,920 | $180,000 | $362,920 |
| 2024 | $3,624 | $542,920 | $180,000 | $362,920 |
| 2023 | $3,733 | $542,920 | $180,000 | $362,920 |
| 2022 | $3,457 | $347,440 | $130,000 | $217,440 |
| 2021 | $3,544 | $347,440 | $130,000 | $217,440 |
| 2020 | $3,400 | $346,720 | $130,000 | $216,720 |
| 2019 | $3,225 | $347,440 | $130,000 | $217,440 |
| 2018 | $2,801 | $319,940 | $118,000 | $201,940 |
| 2017 | $2,769 | $319,940 | $118,000 | $201,940 |
| 2015 | $2,737 | $319,940 | $118,000 | $201,940 |
| 2014 | $2,656 | $310,480 | $88,000 | $222,480 |
| 2013 | -- | $310,480 | $88,000 | $222,480 |
Source: Public Records
Map
Nearby Homes
- 3451 Niagara Carthage Rd
- 42 Shadow Ln
- 13 Pine Lake Dr
- 1 Country Club Blvd
- 510 Nicely
- 515 Nicely Way
- 525 Nicely
- TBD Goldenrod Dr
- 15 Goldenrod Dr
- 30 Sabbatia Dr
- 7 Goldenrod Dr
- 117 Lakeview Dr
- 204 Lakeview Dr
- 37 Princess Gate Dr
- 19 Windsong Place
- 5 Birdie Dr
- TBD Queens Cove Way
- 14 Victoria Dr
- 32 Bogie Dr
- 10 Fairway Dr
Your Personal Tour Guide
Ask me questions while you tour the home.