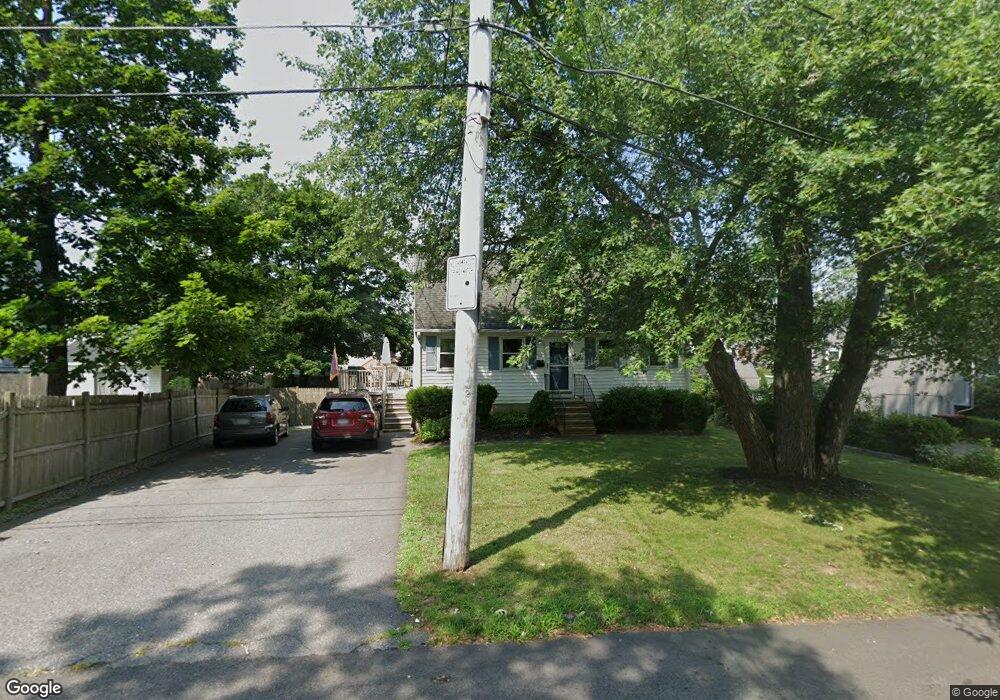
16 Sherman St Brockton, MA 02302
Estimated Value: $519,000 - $540,000
3
Beds
2
Baths
1,593
Sq Ft
$334/Sq Ft
Est. Value
About This Home
This home is located at 16 Sherman St, Brockton, MA 02302 and is currently estimated at $531,870, approximately $333 per square foot. 16 Sherman St is a home located in Plymouth County with nearby schools including Brookfield Elementary School, Downey Elementary School, and Ashfield Middle School.
Ownership History
Date
Name
Owned For
Owner Type
Purchase Details
Closed on
Feb 10, 2021
Sold by
Pacella Arthur M
Bought by
Pacella Ft
Current Estimated Value
Purchase Details
Closed on
Aug 4, 1992
Sold by
Federal Home Loan Mortgage Corporation
Bought by
Pacella Arthur M
Purchase Details
Closed on
Feb 24, 1987
Sold by
Sherman St Rt
Bought by
Hicks Ronald J
Create a Home Valuation Report for This Property
The Home Valuation Report is an in-depth analysis detailing your home's value as well as a comparison with similar homes in the area
Home Values in the Area
Average Home Value in this Area
Purchase History
| Date | Buyer | Sale Price | Title Company |
|---|---|---|---|
| Pacella Ft | -- | None Available | |
| Pacella Arthur M | $74,675 | -- | |
| Hicks Ronald J | $136,000 | -- |
Source: Public Records
Mortgage History
| Date | Status | Borrower | Loan Amount |
|---|---|---|---|
| Previous Owner | Hicks Ronald J | $75,000 | |
| Previous Owner | Hicks Ronald J | $68,000 | |
| Previous Owner | Hicks Ronald J | $82,050 | |
| Previous Owner | Hicks Ronald J | $28,200 |
Source: Public Records
Tax History Compared to Growth
Tax History
| Year | Tax Paid | Tax Assessment Tax Assessment Total Assessment is a certain percentage of the fair market value that is determined by local assessors to be the total taxable value of land and additions on the property. | Land | Improvement |
|---|---|---|---|---|
| 2025 | $5,602 | $462,600 | $144,400 | $318,200 |
| 2024 | $5,439 | $452,500 | $144,400 | $308,100 |
| 2023 | $5,522 | $425,400 | $109,300 | $316,100 |
| 2022 | $5,147 | $368,400 | $99,300 | $269,100 |
| 2021 | $5,121 | $353,200 | $92,900 | $260,300 |
| 2020 | $5,196 | $343,000 | $89,100 | $253,900 |
| 2019 | $4,737 | $304,800 | $83,000 | $221,800 |
| 2018 | $4,294 | $277,100 | $83,000 | $194,100 |
| 2017 | $4,294 | $266,700 | $83,000 | $183,700 |
| 2016 | $3,849 | $221,700 | $79,100 | $142,600 |
| 2015 | $3,409 | $187,800 | $79,100 | $108,700 |
| 2014 | $3,546 | $195,600 | $79,100 | $116,500 |
Source: Public Records
Map
Nearby Homes