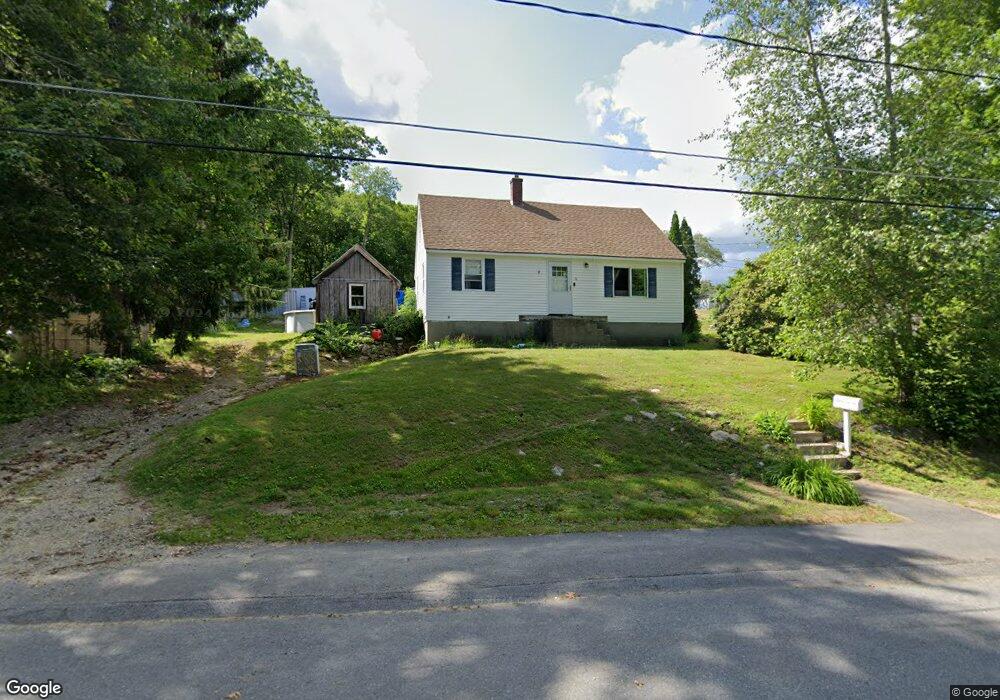
16 Sherwood Rd Auburn, MA 01501
Stoneville NeighborhoodEstimated Value: $310,000 - $483,000
3
Beds
2
Baths
1,387
Sq Ft
$305/Sq Ft
Est. Value
About This Home
This home is located at 16 Sherwood Rd, Auburn, MA 01501 and is currently estimated at $422,977, approximately $304 per square foot. 16 Sherwood Rd is a home located in Worcester County with nearby schools including Auburn Senior High School and Shrewsbury Montessori School - Auburn Campus.
Ownership History
Date
Name
Owned For
Owner Type
Purchase Details
Closed on
Oct 30, 2001
Sold by
Gedenberg Ernest J and Gedenberg Louise A
Bought by
Gedenberg Paul
Current Estimated Value
Home Financials for this Owner
Home Financials are based on the most recent Mortgage that was taken out on this home.
Original Mortgage
$116,725
Interest Rate
6.86%
Mortgage Type
Purchase Money Mortgage
Create a Home Valuation Report for This Property
The Home Valuation Report is an in-depth analysis detailing your home's value as well as a comparison with similar homes in the area
Home Values in the Area
Average Home Value in this Area
Purchase History
| Date | Buyer | Sale Price | Title Company |
|---|---|---|---|
| Gedenberg Paul | $135,000 | -- |
Source: Public Records
Mortgage History
| Date | Status | Borrower | Loan Amount |
|---|---|---|---|
| Open | Gedenberg Paul | $150,985 | |
| Closed | Gedenberg Paul | $116,725 | |
| Previous Owner | Gedenberg Paul | $29,000 |
Source: Public Records
Tax History Compared to Growth
Tax History
| Year | Tax Paid | Tax Assessment Tax Assessment Total Assessment is a certain percentage of the fair market value that is determined by local assessors to be the total taxable value of land and additions on the property. | Land | Improvement |
|---|---|---|---|---|
| 2025 | $54 | $376,900 | $126,200 | $250,700 |
| 2024 | $5,340 | $357,700 | $120,200 | $237,500 |
| 2023 | $5,250 | $330,600 | $109,200 | $221,400 |
| 2022 | $4,911 | $292,000 | $109,200 | $182,800 |
| 2021 | $4,546 | $250,600 | $96,400 | $154,200 |
| 2020 | $4,396 | $244,500 | $96,400 | $148,100 |
| 2019 | $5,096 | $229,700 | $95,400 | $134,300 |
| 2018 | $12,103 | $216,000 | $89,200 | $126,800 |
| 2017 | $3,729 | $203,300 | $80,900 | $122,400 |
| 2016 | $3,609 | $199,500 | $84,800 | $114,700 |
| 2015 | $3,319 | $192,300 | $84,800 | $107,500 |
| 2014 | $3,242 | $187,500 | $80,700 | $106,800 |
Source: Public Records
Map
Nearby Homes