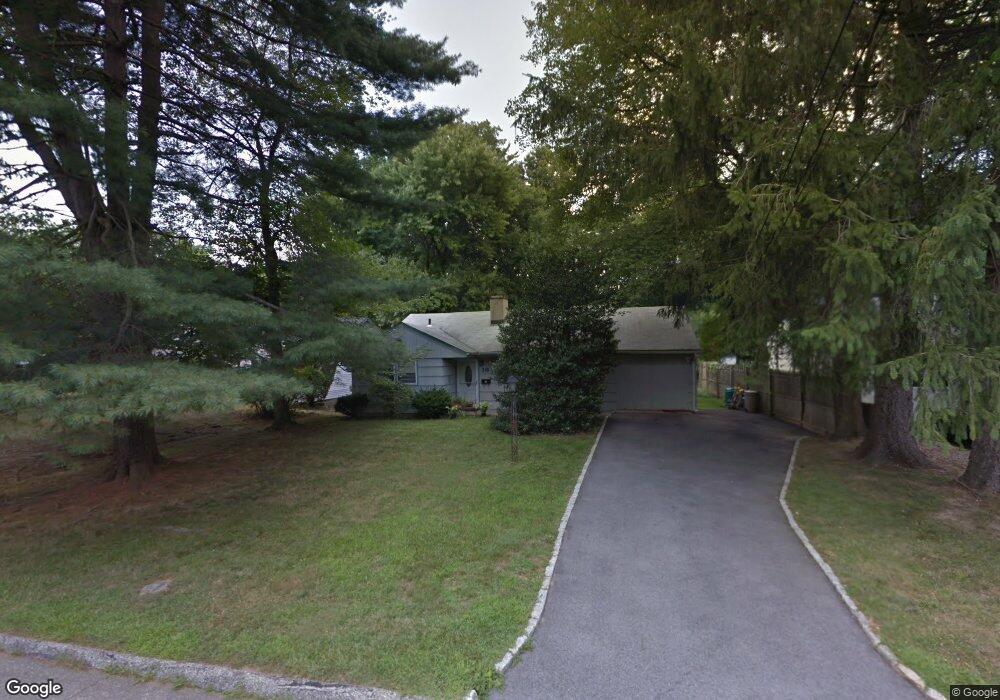
16 Shirley St Norwalk, CT 06850
Spring Hill NeighborhoodEstimated Value: $512,390 - $566,000
2
Beds
1
Bath
1,222
Sq Ft
$443/Sq Ft
Est. Value
About This Home
This home is located at 16 Shirley St, Norwalk, CT 06850 and is currently estimated at $541,348, approximately $443 per square foot. 16 Shirley St is a home located in Fairfield County with nearby schools including Kendall Elementary School, Ponus Ridge Middle School, and Brien Mcmahon High School.
Ownership History
Date
Name
Owned For
Owner Type
Purchase Details
Closed on
Jul 23, 2024
Sold by
Lefort Nancy C Est and Lefort
Bought by
Nova-Yanes Yimy N
Current Estimated Value
Home Financials for this Owner
Home Financials are based on the most recent Mortgage that was taken out on this home.
Original Mortgage
$400,000
Outstanding Balance
$394,827
Interest Rate
6.95%
Mortgage Type
Purchase Money Mortgage
Estimated Equity
$146,521
Purchase Details
Closed on
Dec 1, 1989
Sold by
Mola Bruce
Bought by
Lefort Louis
Home Financials for this Owner
Home Financials are based on the most recent Mortgage that was taken out on this home.
Original Mortgage
$159,700
Interest Rate
9.82%
Mortgage Type
Purchase Money Mortgage
Create a Home Valuation Report for This Property
The Home Valuation Report is an in-depth analysis detailing your home's value as well as a comparison with similar homes in the area
Home Values in the Area
Average Home Value in this Area
Purchase History
| Date | Buyer | Sale Price | Title Company |
|---|---|---|---|
| Nova-Yanes Yimy N | $500,000 | None Available | |
| Nova-Yanes Yimy N | $500,000 | None Available | |
| Nova-Yanes Yimy N | $500,000 | None Available | |
| Lefort Louis | $177,500 | -- |
Source: Public Records
Mortgage History
| Date | Status | Borrower | Loan Amount |
|---|---|---|---|
| Open | Nova-Yanes Yimy N | $400,000 | |
| Closed | Nova-Yanes Yimy N | $400,000 | |
| Previous Owner | Lefort Louis | $138,000 | |
| Previous Owner | Lefort Louis | $152,500 | |
| Previous Owner | Lefort Louis | $159,700 |
Source: Public Records
Tax History Compared to Growth
Tax History
| Year | Tax Paid | Tax Assessment Tax Assessment Total Assessment is a certain percentage of the fair market value that is determined by local assessors to be the total taxable value of land and additions on the property. | Land | Improvement |
|---|---|---|---|---|
| 2025 | $6,856 | $286,310 | $143,680 | $142,630 |
| 2024 | $6,754 | $286,310 | $143,680 | $142,630 |
| 2023 | $4,997 | $198,620 | $112,900 | $85,720 |
| 2022 | $4,904 | $198,620 | $112,900 | $85,720 |
| 2021 | $4,777 | $198,620 | $112,900 | $85,720 |
| 2020 | $4,774 | $198,620 | $112,900 | $85,720 |
| 2019 | $4,641 | $198,620 | $112,900 | $85,720 |
| 2018 | $5,210 | $195,400 | $123,690 | $71,710 |
| 2017 | $5,031 | $195,400 | $123,690 | $71,710 |
| 2016 | $5,038 | $197,580 | $123,690 | $73,890 |
| 2015 | $4,969 | $195,400 | $123,690 | $71,710 |
| 2014 | $4,905 | $195,400 | $123,690 | $71,710 |
Source: Public Records
Map
Nearby Homes
- 14 Windward Rd
- 3 Wynne Rd
- 218 N Taylor Ave
- 63 Ferris Ave
- 29 Nash Place
- 2 Finley St
- 12 Camelot Dr Unit B1
- 2 Coldspring St
- 3 Devon Ave
- 51 1/2 Magnolia Ave
- 150 Fillow St
- 7 Girard St
- 146 Gillies Ln Unit 146
- 31 June Ave
- 14 Ferris Ave Unit 9
- 2 Leuvine St Unit 1
- 45 Maple St Unit 4H
- 50 Fairview Ave Unit 4J
- 50 Fairview Ave Unit 1C
- 18 Prospect Ave Unit C4