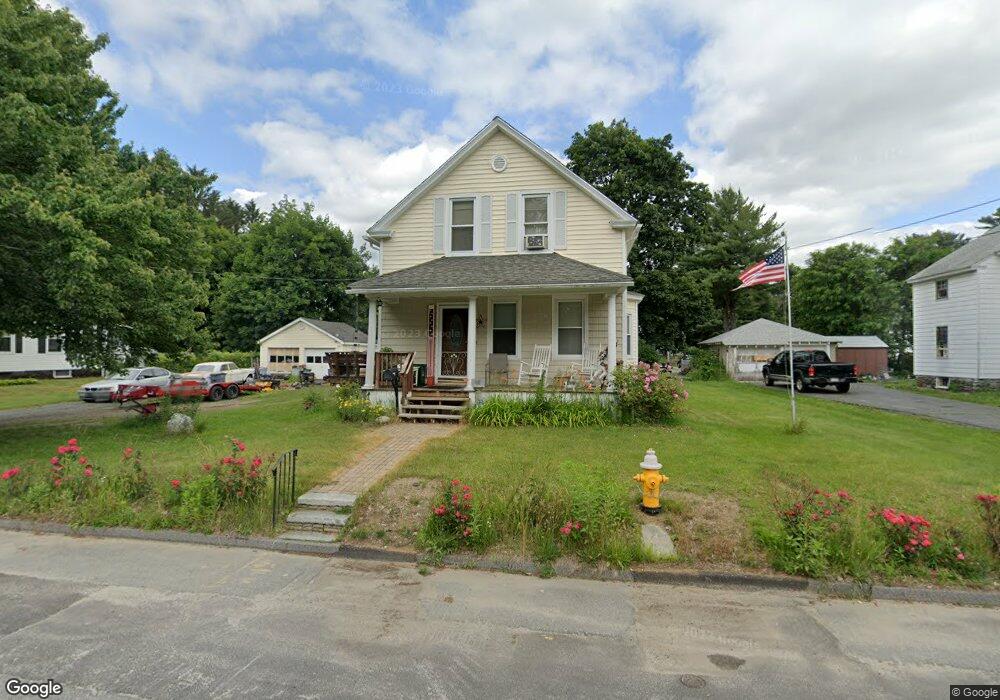
16 Southold Rd Worcester, MA 01607
South Quinsigamond Village NeighborhoodEstimated Value: $370,000 - $401,450
3
Beds
1
Bath
1,185
Sq Ft
$327/Sq Ft
Est. Value
About This Home
This home is located at 16 Southold Rd, Worcester, MA 01607 and is currently estimated at $387,363, approximately $326 per square foot. 16 Southold Rd is a home located in Worcester County with nearby schools including Quinsigamond School, Jacob Hiatt Magnet School, and Chandler Magnet.
Ownership History
Date
Name
Owned For
Owner Type
Purchase Details
Closed on
Apr 19, 2024
Sold by
Zagwyn Ann E
Bought by
Zagwyn Kenneth P
Current Estimated Value
Purchase Details
Closed on
Jun 5, 2019
Sold by
Zagwyn Ann E
Bought by
Zagwyn Ann E and Zagwyn Kenneth P
Purchase Details
Closed on
Jul 14, 1988
Sold by
Collins Theresa S
Bought by
Zagwyn K P
Home Financials for this Owner
Home Financials are based on the most recent Mortgage that was taken out on this home.
Original Mortgage
$77,600
Interest Rate
10.57%
Mortgage Type
Purchase Money Mortgage
Create a Home Valuation Report for This Property
The Home Valuation Report is an in-depth analysis detailing your home's value as well as a comparison with similar homes in the area
Home Values in the Area
Average Home Value in this Area
Purchase History
| Date | Buyer | Sale Price | Title Company |
|---|---|---|---|
| Zagwyn Kenneth P | -- | None Available | |
| Zagwyn Kenneth P | -- | None Available | |
| Zagwyn Ann E | -- | -- | |
| Zagwyn Ann E | -- | -- | |
| Zagwyn K P | $97,000 | -- |
Source: Public Records
Mortgage History
| Date | Status | Borrower | Loan Amount |
|---|---|---|---|
| Previous Owner | Zagwyn K P | $77,600 |
Source: Public Records
Tax History Compared to Growth
Tax History
| Year | Tax Paid | Tax Assessment Tax Assessment Total Assessment is a certain percentage of the fair market value that is determined by local assessors to be the total taxable value of land and additions on the property. | Land | Improvement |
|---|---|---|---|---|
| 2025 | $4,481 | $339,700 | $118,700 | $221,000 |
| 2024 | $4,320 | $314,200 | $118,700 | $195,500 |
| 2023 | $4,134 | $288,300 | $103,200 | $185,100 |
| 2022 | $3,789 | $249,100 | $82,600 | $166,500 |
| 2021 | $3,582 | $220,000 | $66,100 | $153,900 |
| 2020 | $3,436 | $202,100 | $66,100 | $136,000 |
| 2019 | $3,301 | $183,400 | $59,500 | $123,900 |
| 2018 | $3,307 | $174,900 | $59,500 | $115,400 |
| 2017 | $3,167 | $164,800 | $59,500 | $105,300 |
| 2016 | $3,089 | $149,900 | $43,700 | $106,200 |
| 2015 | $3,008 | $149,900 | $43,700 | $106,200 |
| 2014 | $2,929 | $149,900 | $43,700 | $106,200 |
Source: Public Records
Map
Nearby Homes
- 2 Mystic St
- 29 Steele St
- 78 Greenwood St
- 10 Steele St
- 3 Lower Windbrook Dr
- 22 Lesley Ave
- 557 SW Cutoff Unit 107
- 557 SW Cutoff Unit 35
- 557 SW Cutoff Unit 17
- 557 SW Cutoff Unit 79
- 28 Bittersweet Blvd
- 47 Washington St Unit 26
- 72 Sophia Dr
- 55 Tennyson St
- 1295 Millbury St Unit B
- 17 Thenius St
- 2 Breezy Bend
- 30 Davenport St
- 405 Granite St
- 10 Gensell Ave