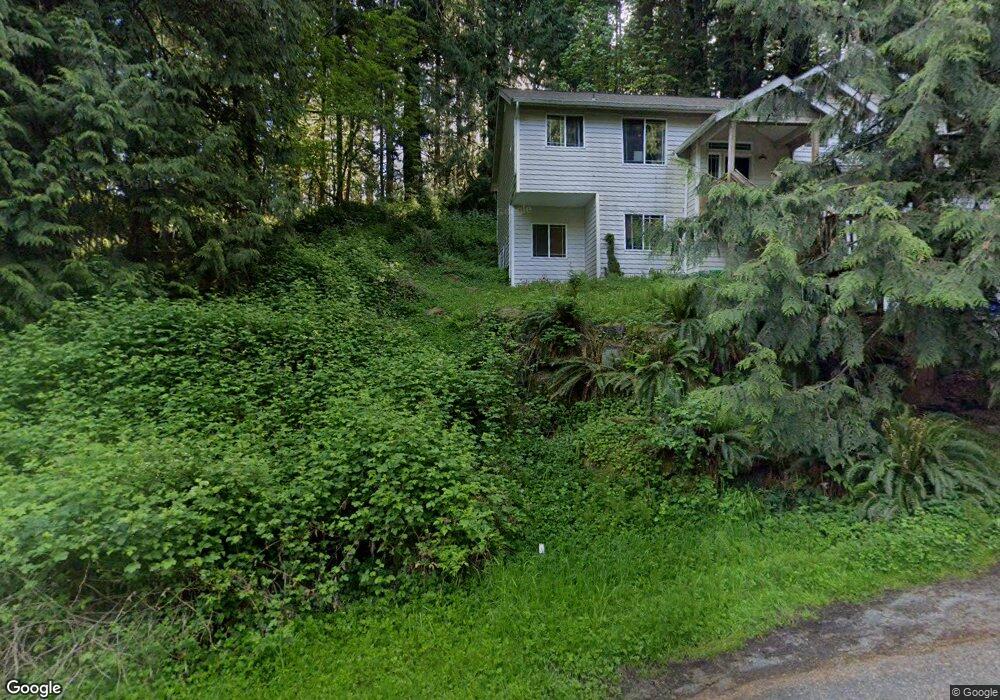
16 Sparrow Ct Bellingham, WA 98229
Estimated Value: $546,000 - $604,000
4
Beds
3
Baths
2,158
Sq Ft
$269/Sq Ft
Est. Value
About This Home
This home is located at 16 Sparrow Ct, Bellingham, WA 98229 and is currently estimated at $581,164, approximately $269 per square foot. 16 Sparrow Ct is a home located in Whatcom County with nearby schools including Geneva Elementary School, Kulshan Middle School, and Bellingham High School.
Ownership History
Date
Name
Owned For
Owner Type
Purchase Details
Closed on
Aug 2, 2019
Sold by
Wright Charles R
Bought by
Aragon Luis
Current Estimated Value
Home Financials for this Owner
Home Financials are based on the most recent Mortgage that was taken out on this home.
Original Mortgage
$222,775
Outstanding Balance
$195,230
Interest Rate
3.73%
Mortgage Type
New Conventional
Estimated Equity
$385,934
Purchase Details
Closed on
Feb 14, 2006
Sold by
Wright Wendy
Bought by
Wright Charles R
Home Financials for this Owner
Home Financials are based on the most recent Mortgage that was taken out on this home.
Original Mortgage
$220,000
Interest Rate
5.5%
Mortgage Type
Fannie Mae Freddie Mac
Purchase Details
Closed on
Jan 20, 2004
Sold by
Sudden Valley Community Assn
Bought by
Island Construction Inc
Purchase Details
Closed on
Jan 22, 2003
Sold by
Chia You Ying Enterprises Co Ltd
Bought by
Sudden Valley Community Assn
Create a Home Valuation Report for This Property
The Home Valuation Report is an in-depth analysis detailing your home's value as well as a comparison with similar homes in the area
Home Values in the Area
Average Home Value in this Area
Purchase History
| Date | Buyer | Sale Price | Title Company |
|---|---|---|---|
| Aragon Luis | $234,505 | Chicago Title Insurance | |
| Wright Charles R | -- | Whatcom Land Title | |
| Wright Charles R | $275,280 | Whatcom Land Title | |
| Island Construction Inc | -- | Whatcom Land Title | |
| Sudden Valley Community Assn | -- | Whatcom Land Title |
Source: Public Records
Mortgage History
| Date | Status | Borrower | Loan Amount |
|---|---|---|---|
| Open | Aragon Luis | $222,775 | |
| Previous Owner | Wright Charles R | $220,000 | |
| Previous Owner | Wright Charles R | $41,250 |
Source: Public Records
Tax History Compared to Growth
Tax History
| Year | Tax Paid | Tax Assessment Tax Assessment Total Assessment is a certain percentage of the fair market value that is determined by local assessors to be the total taxable value of land and additions on the property. | Land | Improvement |
|---|---|---|---|---|
| 2024 | $4,184 | $478,796 | $151,785 | $327,011 |
| 2023 | $4,184 | $481,720 | $152,712 | $329,008 |
| 2022 | $3,335 | $415,287 | $131,652 | $283,635 |
| 2021 | $3,197 | $300,933 | $95,400 | $205,533 |
| 2020 | $3,262 | $283,899 | $90,000 | $193,899 |
| 2019 | $2,984 | $287,845 | $69,044 | $218,801 |
| 2018 | $2,993 | $270,271 | $64,800 | $205,471 |
| 2017 | $2,528 | $230,965 | $55,350 | $175,615 |
| 2016 | $2,266 | $203,190 | $48,600 | $154,590 |
| 2015 | $2,269 | $190,611 | $46,323 | $144,288 |
| 2014 | -- | $185,167 | $45,000 | $140,167 |
| 2013 | -- | $187,659 | $42,600 | $145,059 |
Source: Public Records
Map
Nearby Homes
- 18 Sparrow Ct
- 20 Sparrow Ct
- 14 Woodpecker Place
- 16 Southern Ct
- 1 Southern Ct
- 13 Star View Ln
- 9 Grand View Ln
- 28 Grand View Ln
- 1 Lake Louise Dr Unit 42
- 2 Marigold Dr Unit 26
- 2 Marigold Dr Unit 36
- 66 Grand View Ln
- 63 Louise View Dr
- 6 Lake Louise Dr
- 9 Marigold Dr
- 15 Wintercress Way
- 22 Marigold Dr Unit 34
- 22 Marigold Dr Unit 45
- 3 Acorn Place
- 41 Marigold Dr
- 14 Sparrow Ct
- 12 Sparrow Ct
- 11 Sparrow Ct
- 13 Sparrow Ct
- 10 Sparrow Ct
- 7 Sparrow Ct
- 15 Sparrow Ct
- 12 Woodpecker Place
- 5 Sparrow Ct
- 6 Sparrow Ct
- 10 Woodpecker Place
- 4 Sparrow Ct
- 15 Woodpecker Place
- 8 Woodpecker Place
- 1 Sparrow Ct
- 2 Sparrow Ct
- 6 Woodpecker Place
- 11 Woodpecker Place
- 58 Lake Louise Dr
- 4 Woodpecker Place