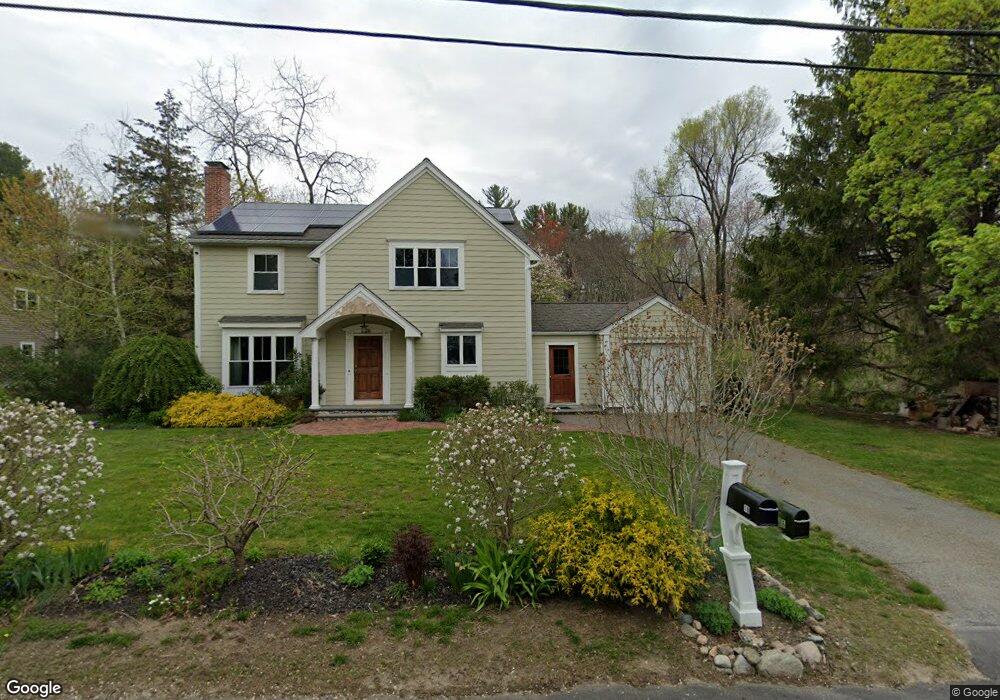
16 Springhill Rd Wayland, MA 01778
Estimated Value: $1,001,000 - $1,221,000
2
Beds
1
Bath
1,120
Sq Ft
$970/Sq Ft
Est. Value
About This Home
This home is located at 16 Springhill Rd, Wayland, MA 01778 and is currently estimated at $1,086,374, approximately $969 per square foot. 16 Springhill Rd is a home located in Middlesex County with nearby schools including Wayland High School and Veritas Christian Academy.
Ownership History
Date
Name
Owned For
Owner Type
Purchase Details
Closed on
Aug 29, 2003
Sold by
Bolotovsky Robert
Bought by
Sheehan Colleen M and Sheehan Timothy M
Current Estimated Value
Home Financials for this Owner
Home Financials are based on the most recent Mortgage that was taken out on this home.
Original Mortgage
$294,900
Interest Rate
5.69%
Mortgage Type
Purchase Money Mortgage
Purchase Details
Closed on
Apr 21, 2000
Sold by
Hamilton-Smith David
Bought by
Bolotovsky Robert
Purchase Details
Closed on
Dec 4, 1992
Sold by
Baker Jean F
Bought by
Smith David Hamilton
Create a Home Valuation Report for This Property
The Home Valuation Report is an in-depth analysis detailing your home's value as well as a comparison with similar homes in the area
Home Values in the Area
Average Home Value in this Area
Purchase History
| Date | Buyer | Sale Price | Title Company |
|---|---|---|---|
| Sheehan Colleen M | $379,900 | -- | |
| Sheehan Colleen M | $379,900 | -- | |
| Bolotovsky Robert | $259,000 | -- | |
| Smith David Hamilton | $168,500 | -- |
Source: Public Records
Mortgage History
| Date | Status | Borrower | Loan Amount |
|---|---|---|---|
| Open | Smith David Hamilton | $356,000 | |
| Closed | Smith David Hamilton | $371,000 | |
| Closed | Sheehan Colleen M | $294,900 |
Source: Public Records
Tax History Compared to Growth
Tax History
| Year | Tax Paid | Tax Assessment Tax Assessment Total Assessment is a certain percentage of the fair market value that is determined by local assessors to be the total taxable value of land and additions on the property. | Land | Improvement |
|---|---|---|---|---|
| 2025 | $14,581 | $932,900 | $477,800 | $455,100 |
| 2024 | $13,808 | $889,700 | $455,100 | $434,600 |
| 2023 | $12,987 | $780,000 | $413,800 | $366,200 |
| 2022 | $12,548 | $683,800 | $342,700 | $341,100 |
| 2021 | $4,214 | $652,600 | $311,500 | $341,100 |
| 2020 | $11,590 | $652,600 | $311,500 | $341,100 |
| 2019 | $11,101 | $607,300 | $296,800 | $310,500 |
| 2018 | $3,884 | $577,300 | $296,800 | $280,500 |
| 2017 | $10,055 | $554,300 | $282,600 | $271,700 |
| 2016 | $9,861 | $568,700 | $307,900 | $260,800 |
| 2015 | $10,094 | $548,900 | $307,900 | $241,000 |
Source: Public Records
Map
Nearby Homes
- 156 Boston Post Rd
- 14 Lundy Ln
- 10 Hayward Rd
- 31 White Rd
- 19 Old Connecticut Path
- 24 Claypit Hill Rd
- 17 Hastings Way Unit 17
- 9 River Rock Way Unit 9
- 42 Westerly Rd
- 17 Glezen Ln
- 12 Astra
- 1601 Wisteria Way
- 606 Wisteria Way
- 8 Fox Hollow
- 180 Highland St
- 15 Lewis Path
- 6 Steepletree Ln
- 24 Jericho Rd Unit 24
- 125 Woodridge Rd
- 262 Cochituate Rd