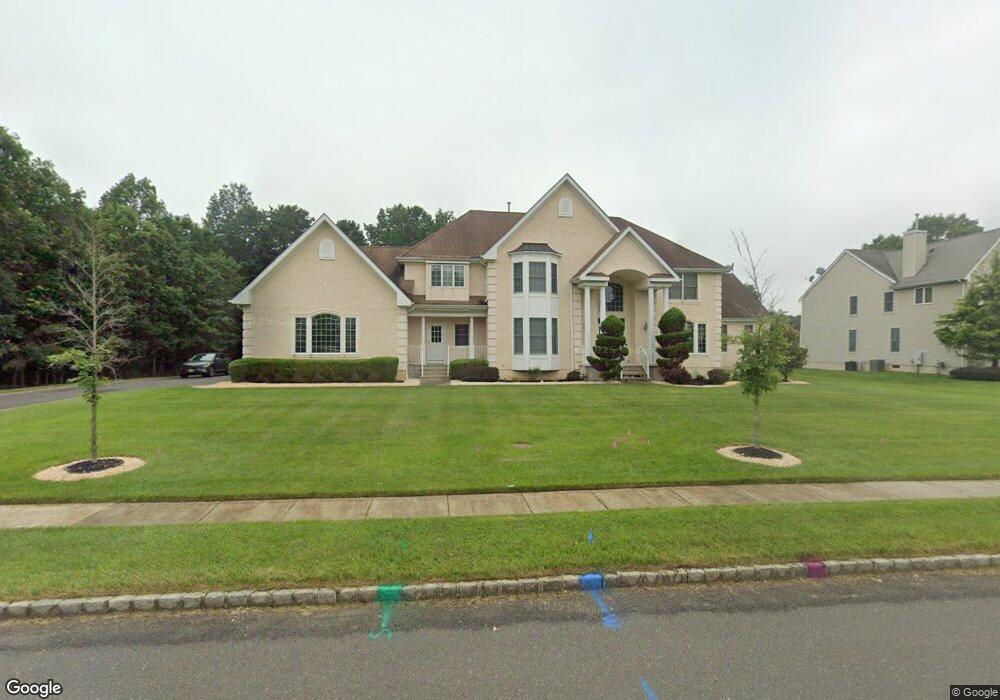
16 St James St Monroe Township, NJ 08831
Estimated Value: $1,462,000 - $1,526,000
--
Bed
--
Bath
5,057
Sq Ft
$294/Sq Ft
Est. Value
About This Home
This home is located at 16 St James St, Monroe Township, NJ 08831 and is currently estimated at $1,488,542, approximately $294 per square foot. 16 St James St is a home located in Middlesex County with nearby schools including Mill Lake Elementary School, Woodland Elementary School, and Monroe Township Middle School.
Ownership History
Date
Name
Owned For
Owner Type
Purchase Details
Closed on
Feb 27, 2024
Sold by
Paluri Anand and Paluri Vasantha
Bought by
Avp Family Trust and Paluri
Current Estimated Value
Purchase Details
Closed on
Sep 29, 2006
Sold by
Centex Homes Llc
Bought by
Paluri Anand and Paluri Vasantha
Home Financials for this Owner
Home Financials are based on the most recent Mortgage that was taken out on this home.
Original Mortgage
$417,000
Interest Rate
6.49%
Create a Home Valuation Report for This Property
The Home Valuation Report is an in-depth analysis detailing your home's value as well as a comparison with similar homes in the area
Home Values in the Area
Average Home Value in this Area
Purchase History
| Date | Buyer | Sale Price | Title Company |
|---|---|---|---|
| Avp Family Trust | -- | None Listed On Document | |
| Avp Family Trust | -- | None Listed On Document | |
| Paluri Anand | $969,210 | -- | |
| -- | $969,200 | -- |
Source: Public Records
Mortgage History
| Date | Status | Borrower | Loan Amount |
|---|---|---|---|
| Previous Owner | -- | $417,000 |
Source: Public Records
Tax History Compared to Growth
Tax History
| Year | Tax Paid | Tax Assessment Tax Assessment Total Assessment is a certain percentage of the fair market value that is determined by local assessors to be the total taxable value of land and additions on the property. | Land | Improvement |
|---|---|---|---|---|
| 2025 | $22,903 | $820,600 | $196,800 | $623,800 |
| 2024 | $22,107 | $820,600 | $196,800 | $623,800 |
| 2023 | $22,107 | $820,600 | $196,800 | $623,800 |
| 2022 | $21,762 | $820,600 | $196,800 | $623,800 |
| 2021 | $16,223 | $820,600 | $196,800 | $623,800 |
| 2020 | $21,647 | $820,600 | $196,800 | $623,800 |
| 2019 | $21,180 | $820,600 | $196,800 | $623,800 |
| 2018 | $21,016 | $820,600 | $196,800 | $623,800 |
| 2017 | $20,605 | $820,600 | $196,800 | $623,800 |
| 2016 | $20,302 | $820,600 | $196,800 | $623,800 |
| 2015 | $19,727 | $820,600 | $196,800 | $623,800 |
| 2014 | $18,923 | $734,700 | $196,800 | $537,900 |
Source: Public Records
Map
Nearby Homes