Estimated Value: $56,000 - $72,813
1
Bed
1
Bath
1,080
Sq Ft
$59/Sq Ft
Est. Value
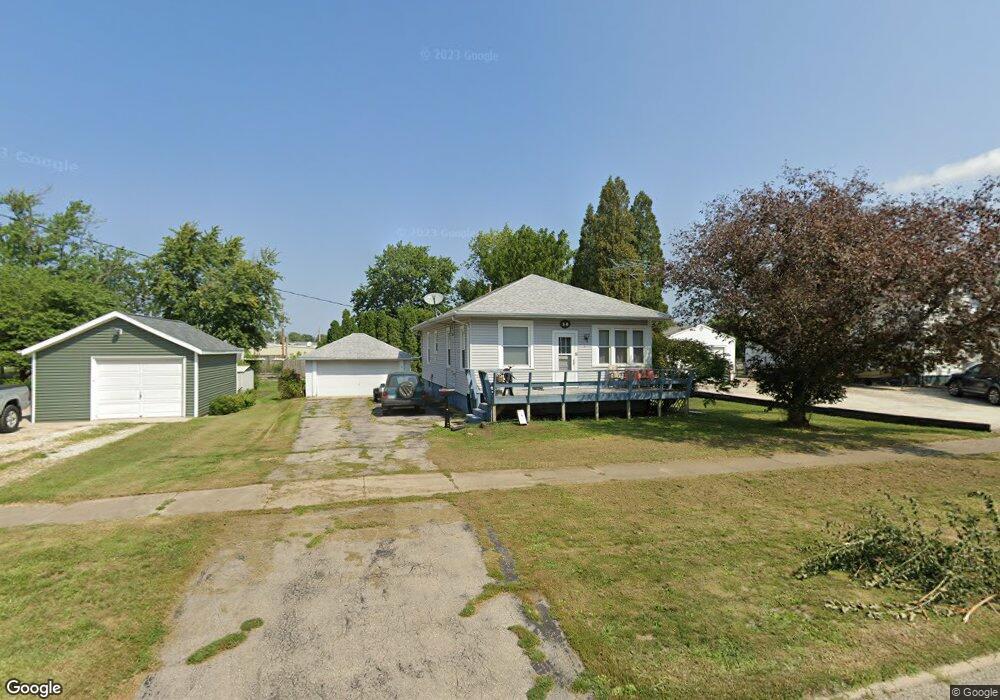
About This Home
This home is located at 16 SW 4th St, Galva, IL 61434 and is currently estimated at $64,203, approximately $59 per square foot. 16 SW 4th St is a home located in Henry County with nearby schools including Galva Elementary School and Galva Junior/Senior High School.
Ownership History
Date
Name
Owned For
Owner Type
Purchase Details
Closed on
Jun 14, 2019
Sold by
Sieghartner Lisa A and Sieghartner Robert H
Bought by
Harris James S
Current Estimated Value
Home Financials for this Owner
Home Financials are based on the most recent Mortgage that was taken out on this home.
Original Mortgage
$37,828
Outstanding Balance
$33,756
Interest Rate
4.87%
Mortgage Type
New Conventional
Estimated Equity
$30,447
Purchase Details
Closed on
Aug 3, 2006
Sold by
Wells Fargo Bank
Bought by
Hanson Lisa A
Home Financials for this Owner
Home Financials are based on the most recent Mortgage that was taken out on this home.
Original Mortgage
$45,000
Interest Rate
6.7%
Mortgage Type
New Conventional
Create a Home Valuation Report for This Property
The Home Valuation Report is an in-depth analysis detailing your home's value as well as a comparison with similar homes in the area
Home Values in the Area
Average Home Value in this Area
Purchase History
| Date | Buyer | Sale Price | Title Company |
|---|---|---|---|
| Harris James S | $35,000 | Attorney | |
| Hanson Lisa A | $45,000 | None Available |
Source: Public Records
Mortgage History
| Date | Status | Borrower | Loan Amount |
|---|---|---|---|
| Open | Harris James S | $37,828 | |
| Previous Owner | Hanson Lisa A | $45,000 |
Source: Public Records
Tax History
| Year | Tax Paid | Tax Assessment Tax Assessment Total Assessment is a certain percentage of the fair market value that is determined by local assessors to be the total taxable value of land and additions on the property. | Land | Improvement |
|---|---|---|---|---|
| 2024 | $858 | $14,660 | $2,099 | $12,561 |
| 2023 | $820 | $14,164 | $2,028 | $12,136 |
| 2022 | $682 | $12,647 | $1,811 | $10,836 |
| 2021 | $530 | $11,046 | $1,582 | $9,464 |
| 2020 | $544 | $11,149 | $1,597 | $9,552 |
| 2019 | $2,002 | $19,422 | $1,719 | $17,703 |
| 2018 | $1,955 | $18,856 | $1,669 | $17,187 |
| 2017 | $1,891 | $18,360 | $1,625 | $16,735 |
| 2016 | $1,927 | $18,269 | $1,617 | $16,652 |
| 2015 | $1,076 | $18,269 | $1,617 | $16,652 |
| 2013 | $1,076 | $18,453 | $1,633 | $16,820 |
Source: Public Records
Map
Nearby Homes
- 103 SW 4th St
- 415 SW 4th Ave
- 417 NE 2nd St
- 806 NE 3rd St
- 2001 Olof Krans Ave
- 2103 Olof Krans Ave
- 2321 Olof Krans Ave
- 2320 Olof Krans Ave
- 2439 Olof Krans Ave
- 2440 Olof Krans Ave
- 2460 Olof Krans Ave
- 2549 Olof Krans Ave
- 2530 Olof Krans Ave
- 2659 Olof Krans Ave
- 2932 Illinois 17
- 2769 Olof Krans Ave
- 2832 Illinois 17
- 2200 2800 N
- 0 Knox Road 1600 E
- 0 W South St
Your Personal Tour Guide
Ask me questions while you tour the home.