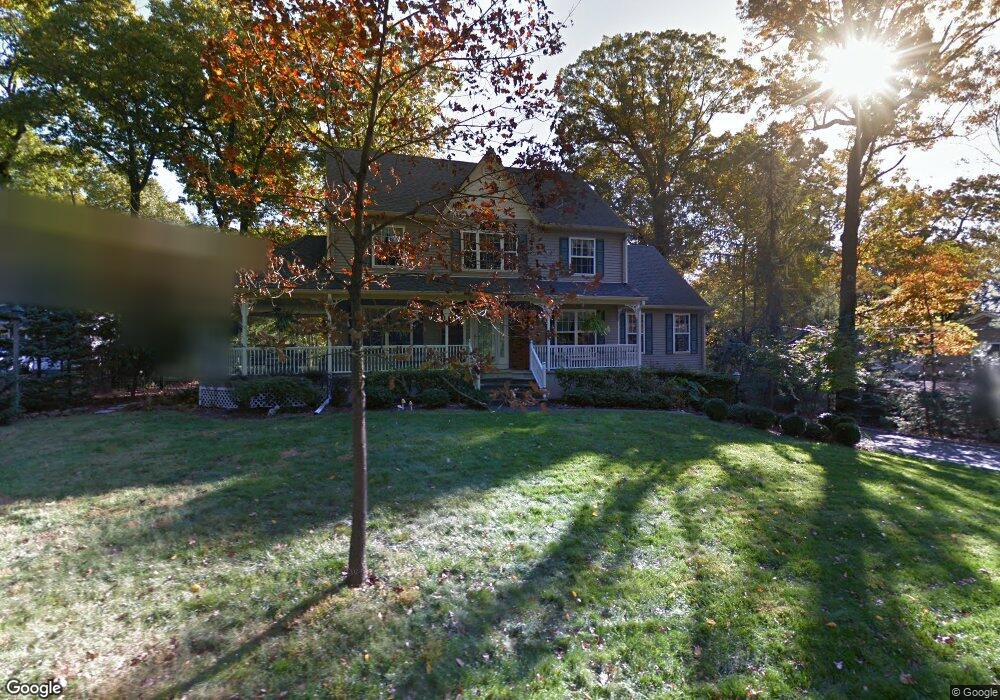
16 Swanson Ln Green Brook, NJ 08812
Estimated Value: $759,295 - $838,000
--
Bed
--
Bath
2,502
Sq Ft
$319/Sq Ft
Est. Value
About This Home
This home is located at 16 Swanson Ln, Green Brook, NJ 08812 and is currently estimated at $797,824, approximately $318 per square foot. 16 Swanson Ln is a home located in Somerset County with nearby schools including Irene E. Feldkirchner Elementary School, Green Brook Middle School, and Watchung Hills Regional High School.
Ownership History
Date
Name
Owned For
Owner Type
Purchase Details
Closed on
Mar 16, 2000
Sold by
Grant Scott
Bought by
Kennedy Margaret and Georas Willliam
Current Estimated Value
Home Financials for this Owner
Home Financials are based on the most recent Mortgage that was taken out on this home.
Original Mortgage
$130,000
Outstanding Balance
$44,122
Interest Rate
8.31%
Estimated Equity
$753,702
Purchase Details
Closed on
Mar 11, 1999
Sold by
Kirchofer Maurice
Bought by
Grant Scott and Grant Deborah
Home Financials for this Owner
Home Financials are based on the most recent Mortgage that was taken out on this home.
Original Mortgage
$284,000
Interest Rate
6.73%
Purchase Details
Closed on
Jul 17, 1997
Sold by
Garbarina Michael
Bought by
Kirchoper Marice and Kirchofer Rosemary
Create a Home Valuation Report for This Property
The Home Valuation Report is an in-depth analysis detailing your home's value as well as a comparison with similar homes in the area
Home Values in the Area
Average Home Value in this Area
Purchase History
| Date | Buyer | Sale Price | Title Company |
|---|---|---|---|
| Kennedy Margaret | $401,000 | -- | |
| Grant Scott | $355,000 | -- | |
| Kirchoper Marice | $80,000 | -- |
Source: Public Records
Mortgage History
| Date | Status | Borrower | Loan Amount |
|---|---|---|---|
| Open | Kennedy Margaret | $130,000 | |
| Previous Owner | Grant Scott | $284,000 |
Source: Public Records
Tax History Compared to Growth
Tax History
| Year | Tax Paid | Tax Assessment Tax Assessment Total Assessment is a certain percentage of the fair market value that is determined by local assessors to be the total taxable value of land and additions on the property. | Land | Improvement |
|---|---|---|---|---|
| 2025 | $14,170 | $775,300 | $257,300 | $518,000 |
| 2024 | $14,170 | $640,000 | $251,000 | $389,000 |
| 2023 | $12,073 | $524,900 | $251,000 | $273,900 |
| 2022 | $13,697 | $582,100 | $194,800 | $387,300 |
| 2021 | $13,969 | $582,100 | $194,800 | $387,300 |
| 2020 | $14,033 | $535,200 | $194,800 | $340,400 |
| 2019 | $13,969 | $535,200 | $194,800 | $340,400 |
| 2018 | $13,878 | $535,200 | $194,800 | $340,400 |
| 2017 | $13,567 | $535,200 | $194,800 | $340,400 |
| 2016 | $13,353 | $535,200 | $194,800 | $340,400 |
| 2015 | $12,761 | $501,200 | $194,800 | $306,400 |
| 2014 | $12,735 | $500,000 | $282,500 | $217,500 |
Source: Public Records
Map
Nearby Homes
- 89 Rock Rd W
- 1121 N Washington Ave
- 165 Rock Rd W
- 182 Rock Rd W
- 205 School St
- 3 Tanglewood Ln
- 202 Gold St
- 18 Wildwood Terrace
- 1300 Rock Ave Unit 4
- 1300 Rock Ave Unit 6
- 1300 Rock Ave Unit C4
- 1300 Rock Ave Unit D6
- 302 Tiffany Way Unit 302
- 13 Greenbrier Rd
- 13 Sweeney Ct
- 6 Highland St
- 668 Warfield Rd
- 9 Apple Tree Ln
- 209 Rock Ave
- 112 Greenbrook Rd