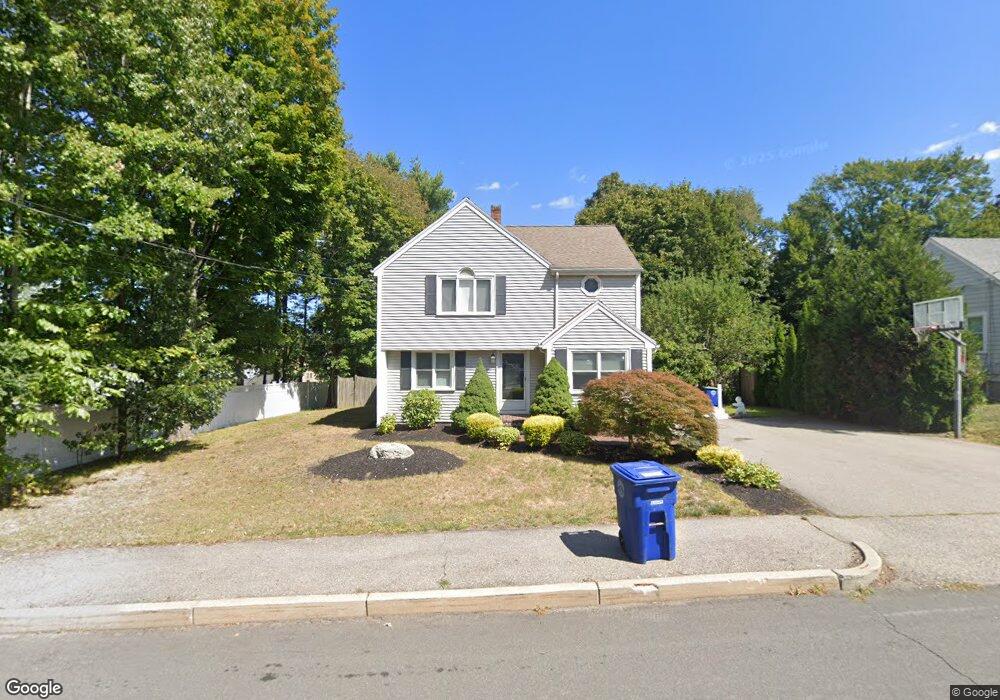
16 Sycamore Rd Braintree, MA 02184
South Braintree NeighborhoodEstimated Value: $863,755 - $902,000
4
Beds
2
Baths
2,044
Sq Ft
$432/Sq Ft
Est. Value
About This Home
This home is located at 16 Sycamore Rd, Braintree, MA 02184 and is currently estimated at $883,439, approximately $432 per square foot. 16 Sycamore Rd is a home located in Norfolk County with nearby schools including Braintree High School, First Baptist Christian School, and Thayer Academy.
Ownership History
Date
Name
Owned For
Owner Type
Purchase Details
Closed on
Aug 25, 2008
Sold by
Zopatti Ann E
Bought by
Fennell Corinne and Fennell Declan
Current Estimated Value
Home Financials for this Owner
Home Financials are based on the most recent Mortgage that was taken out on this home.
Original Mortgage
$355,000
Outstanding Balance
$234,764
Interest Rate
6.4%
Mortgage Type
Purchase Money Mortgage
Estimated Equity
$648,675
Create a Home Valuation Report for This Property
The Home Valuation Report is an in-depth analysis detailing your home's value as well as a comparison with similar homes in the area
Home Values in the Area
Average Home Value in this Area
Purchase History
| Date | Buyer | Sale Price | Title Company |
|---|---|---|---|
| Fennell Corinne | $455,000 | -- |
Source: Public Records
Mortgage History
| Date | Status | Borrower | Loan Amount |
|---|---|---|---|
| Open | Fennell Corinne | $355,000 |
Source: Public Records
Tax History
| Year | Tax Paid | Tax Assessment Tax Assessment Total Assessment is a certain percentage of the fair market value that is determined by local assessors to be the total taxable value of land and additions on the property. | Land | Improvement |
|---|---|---|---|---|
| 2025 | $8,124 | $814,000 | $393,300 | $420,700 |
| 2024 | $7,383 | $778,800 | $362,300 | $416,500 |
| 2023 | $7,077 | $725,100 | $331,200 | $393,900 |
| 2022 | $6,803 | $683,700 | $289,800 | $393,900 |
| 2021 | $6,300 | $633,200 | $261,900 | $371,300 |
| 2020 | $5,853 | $593,600 | $238,100 | $355,500 |
| 2019 | $5,765 | $571,400 | $238,100 | $333,300 |
| 2018 | $5,551 | $526,700 | $207,000 | $319,700 |
| 2017 | $5,352 | $498,300 | $196,700 | $301,600 |
| 2016 | $5,220 | $475,400 | $186,300 | $289,100 |
| 2015 | $5,104 | $461,100 | $182,200 | $278,900 |
| 2014 | $4,779 | $418,500 | $158,400 | $260,100 |
Source: Public Records
Map
Nearby Homes
- 972 Liberty St
- 432 Grove St
- 1 Geraldine Ln
- 23 Portland Rd
- 43 Grove Cir
- 501 Commerce Dr Unit 2110
- 501 Commerce Dr Unit 4308
- 15 Alida Rd
- 426 John Mahar Hwy Unit 311
- 426 John Mahar Hwy Unit 406
- 300 West St
- 422 John Mahar Hwy Unit 408
- 55 Bradford Commons Ln Unit 55
- 418 John Mahar Hwy Unit 408
- 365 Tilden Commons Ln Unit 365
- 169 Tyson Commons Ln
- 24 Evelyn Ln
- 129 Albee Dr
- 145 Hancock St Unit 307
- 145 Hancock St Unit 201
- 20 Sycamore Rd
- 1020 Liberty St
- 1020 Liberty St Unit 1020
- 1024 Liberty St
- 1014 Liberty St
- 26 Sycamore Rd
- 19 Sycamore Rd
- 1034 Liberty St
- 14 Thetford Ave
- 21 Sycamore Rd
- 4 Thetford Ave
- 4 Thetford Ave
- 1044 Liberty St
- 22 Thetford Ave
- 27 Sycamore Rd
- 1006 Liberty St
- 6 Hickory Rd
- 1031 Liberty St
- 18 Forest St
- 1 Hickory Rd
Your Personal Tour Guide
Ask me questions while you tour the home.