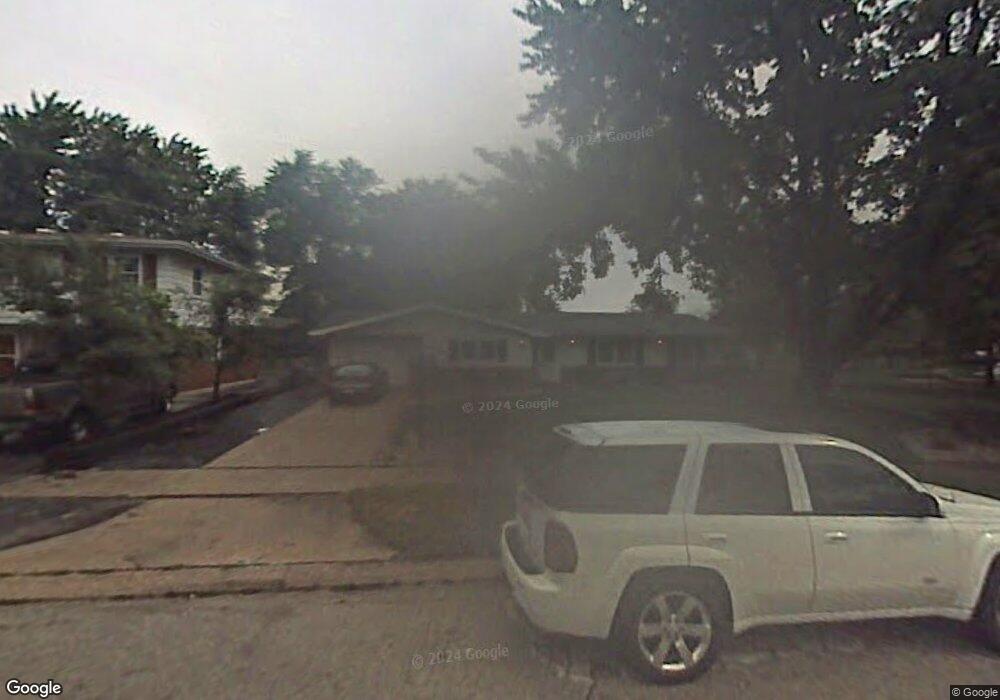
16 Tahoe St Thornton, IL 60476
Estimated Value: $180,000 - $237,000
4
Beds
2
Baths
1,524
Sq Ft
$134/Sq Ft
Est. Value
About This Home
This home is located at 16 Tahoe St, Thornton, IL 60476 and is currently estimated at $204,402, approximately $134 per square foot. 16 Tahoe St is a home located in Cook County with nearby schools including Wolcott School, Thornwood High School, and Calvin Christian School.
Ownership History
Date
Name
Owned For
Owner Type
Purchase Details
Closed on
Jul 26, 2013
Sold by
Lareau Michael F and Franker Lauren M
Bought by
Lareau Michael F
Current Estimated Value
Home Financials for this Owner
Home Financials are based on the most recent Mortgage that was taken out on this home.
Original Mortgage
$103,200
Outstanding Balance
$24,672
Interest Rate
3.62%
Mortgage Type
New Conventional
Estimated Equity
$179,730
Purchase Details
Closed on
Mar 6, 2006
Sold by
Borowski Daniel J and Borowski Jacqueline A
Bought by
Lareau Michael F and Franker Lauren M
Home Financials for this Owner
Home Financials are based on the most recent Mortgage that was taken out on this home.
Original Mortgage
$123,500
Interest Rate
6.33%
Mortgage Type
Fannie Mae Freddie Mac
Purchase Details
Closed on
Jun 29, 2000
Sold by
Calabrese Thomas A and Calabrese Katherine S
Bought by
Borowski Daniel J and Borowski Jacqueline A
Home Financials for this Owner
Home Financials are based on the most recent Mortgage that was taken out on this home.
Original Mortgage
$80,000
Interest Rate
8.31%
Create a Home Valuation Report for This Property
The Home Valuation Report is an in-depth analysis detailing your home's value as well as a comparison with similar homes in the area
Home Values in the Area
Average Home Value in this Area
Purchase History
| Date | Buyer | Sale Price | Title Company |
|---|---|---|---|
| Lareau Michael F | -- | None Available | |
| Lareau Michael F | $130,000 | Ticor Title | |
| Borowski Daniel J | $112,000 | -- |
Source: Public Records
Mortgage History
| Date | Status | Borrower | Loan Amount |
|---|---|---|---|
| Open | Lareau Michael F | $103,200 | |
| Closed | Lareau Michael F | $123,500 | |
| Previous Owner | Borowski Daniel J | $80,000 |
Source: Public Records
Tax History Compared to Growth
Tax History
| Year | Tax Paid | Tax Assessment Tax Assessment Total Assessment is a certain percentage of the fair market value that is determined by local assessors to be the total taxable value of land and additions on the property. | Land | Improvement |
|---|---|---|---|---|
| 2024 | $5,383 | $14,000 | $3,148 | $10,852 |
| 2023 | $3,467 | $14,000 | $3,148 | $10,852 |
| 2022 | $3,467 | $8,802 | $2,755 | $6,047 |
| 2021 | $3,339 | $8,801 | $2,754 | $6,047 |
| 2020 | $3,325 | $8,801 | $2,754 | $6,047 |
| 2019 | $4,340 | $10,857 | $2,558 | $8,299 |
| 2018 | $4,159 | $10,857 | $2,558 | $8,299 |
| 2017 | $4,378 | $11,193 | $2,558 | $8,635 |
| 2016 | $3,389 | $8,609 | $2,361 | $6,248 |
| 2015 | $3,138 | $8,609 | $2,361 | $6,248 |
| 2014 | $3,083 | $8,609 | $2,361 | $6,248 |
| 2013 | $3,540 | $10,546 | $2,361 | $8,185 |
Source: Public Records
Map
Nearby Homes
- 29 Arapaho Dr Unit 2
- 59 Indianwood Dr
- 14 Arrowhead Dr
- 636 E 173rd St
- 816 Sunnyside Ave
- 920 Sunnyside Ave
- 17148 Evans Dr
- 324 E 173rd Place
- 17060 Evans Dr
- 101 Bonnie Ct
- 17324 Greenwood Ave
- 104 Anne Ct
- 311 N Kinzie St
- 739 E 170th St
- 214 N Hunter St
- 210 Maple Ln
- 17129 Greenwood Ave
- 101 N Kinzie St
- 17339 Kimbark Ave
- 949 E 170th St