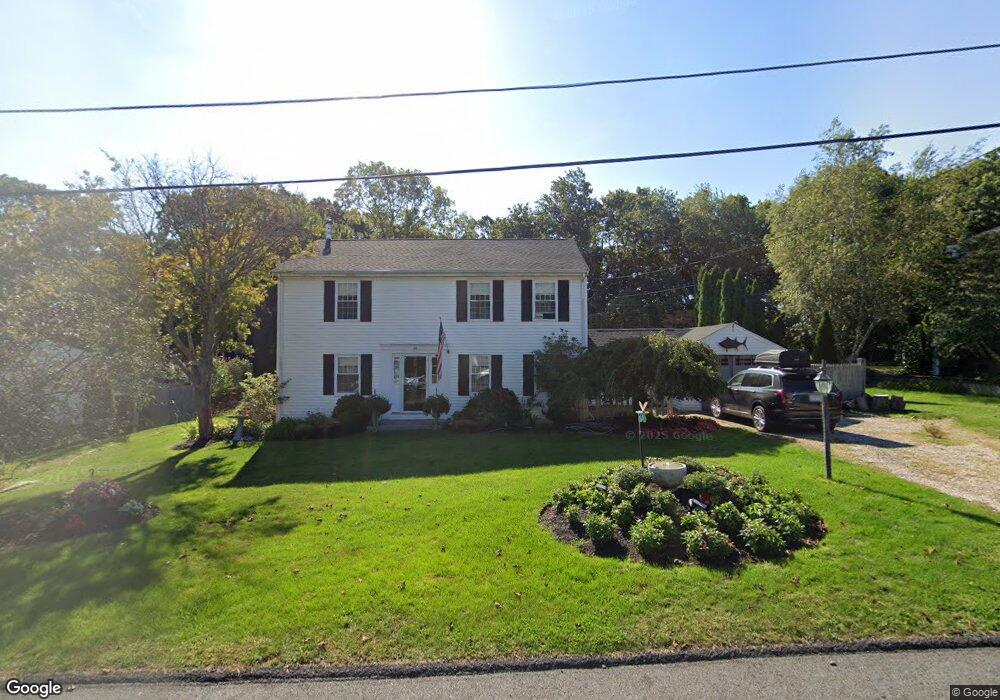
16 Thomas Ave Scituate, MA 02066
Estimated Value: $781,277 - $1,004,000
3
Beds
2
Baths
1,632
Sq Ft
$527/Sq Ft
Est. Value
About This Home
This home is located at 16 Thomas Ave, Scituate, MA 02066 and is currently estimated at $859,819, approximately $526 per square foot. 16 Thomas Ave is a home located in Plymouth County with nearby schools including Wampatuck Elementary School, Lester J. Gates Middle School, and Scituate High School.
Ownership History
Date
Name
Owned For
Owner Type
Purchase Details
Closed on
Jan 16, 2020
Sold by
Toll Ma Land 3 Lp
Bought by
Catherine Ann Brennan T
Current Estimated Value
Purchase Details
Closed on
Dec 11, 1996
Sold by
Adams Daniel J and Adams Jennifer H
Bought by
Libby Timothy J and Libby Tracee L
Purchase Details
Closed on
Feb 26, 1993
Sold by
Johnson Elizabeth M
Bought by
Adams Daniel J and Adams Jennifer H
Create a Home Valuation Report for This Property
The Home Valuation Report is an in-depth analysis detailing your home's value as well as a comparison with similar homes in the area
Home Values in the Area
Average Home Value in this Area
Purchase History
| Date | Buyer | Sale Price | Title Company |
|---|---|---|---|
| Catherine Ann Brennan T | $720,980 | None Available | |
| Libby Timothy J | $147,000 | -- | |
| Adams Daniel J | $87,500 | -- |
Source: Public Records
Mortgage History
| Date | Status | Borrower | Loan Amount |
|---|---|---|---|
| Previous Owner | Adams Daniel J | $339,000 | |
| Previous Owner | Adams Daniel J | $336,000 | |
| Previous Owner | Adams Daniel J | $35,500 |
Source: Public Records
Tax History
| Year | Tax Paid | Tax Assessment Tax Assessment Total Assessment is a certain percentage of the fair market value that is determined by local assessors to be the total taxable value of land and additions on the property. | Land | Improvement |
|---|---|---|---|---|
| 2025 | $6,366 | $637,200 | $357,600 | $279,600 |
| 2024 | $6,251 | $603,400 | $325,100 | $278,300 |
| 2023 | $6,244 | $573,600 | $311,900 | $261,700 |
| 2022 | $6,244 | $494,800 | $275,200 | $219,600 |
| 2021 | $6,101 | $457,700 | $262,100 | $195,600 |
| 2020 | $5,920 | $438,500 | $252,000 | $186,500 |
| 2019 | $5,846 | $425,500 | $247,000 | $178,500 |
| 2018 | $5,733 | $411,000 | $250,300 | $160,700 |
| 2017 | $5,557 | $394,400 | $239,800 | $154,600 |
| 2016 | $5,283 | $373,600 | $219,000 | $154,600 |
| 2015 | $4,757 | $363,100 | $208,500 | $154,600 |
Source: Public Records
Map
Nearby Homes
- 20 Lee Ave
- 1 Washington Ln
- 49 Jackson Rd
- 20 Lawson Rd
- 38 Lauren Ln
- 74 Branch St Unit 15
- 111 Elm St
- 34 Cudworth Rd
- 20 Grace Way Unit 20
- 6 Grace Way Unit 6
- 27 Grace Way
- 46 Tilden Rd
- 115 Elm St
- 327 Country Way
- 86 Hatherly Rd
- 54 Woodland Rd
- 50 First Parish Rd
- 25 Morton Place
- 32 Barker Rd Unit 3
- 11 Brookline Rd
Your Personal Tour Guide
Ask me questions while you tour the home.