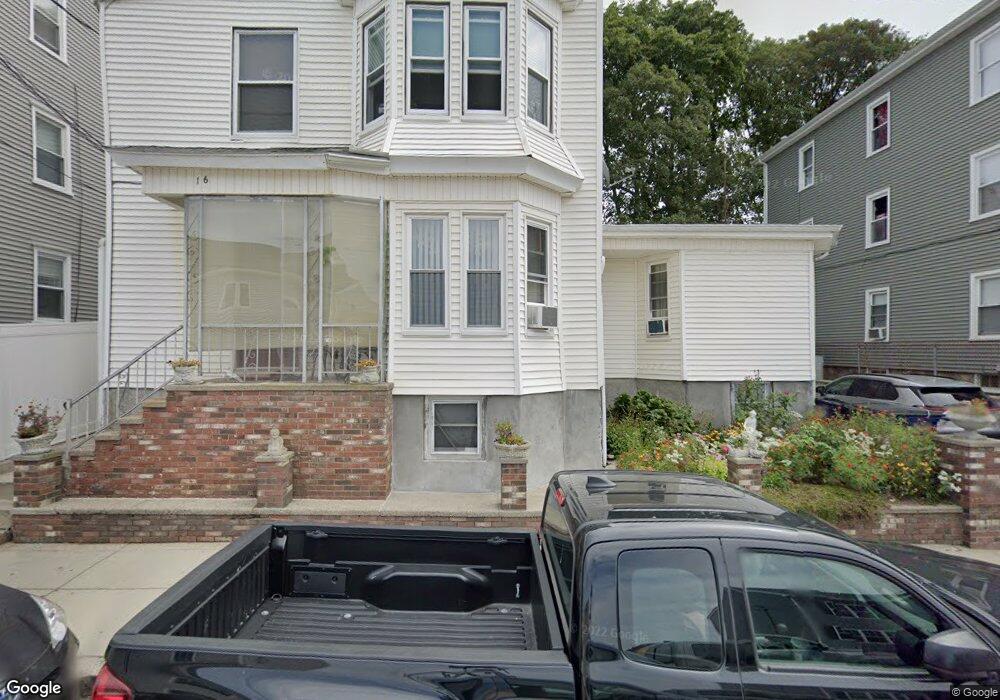
16 Thomas St Fall River, MA 02723
Flint NeighborhoodEstimated Value: $590,000 - $646,000
7
Beds
3
Baths
2,592
Sq Ft
$239/Sq Ft
Est. Value
About This Home
This home is located at 16 Thomas St, Fall River, MA 02723 and is currently estimated at $620,723, approximately $239 per square foot. 16 Thomas St is a home located in Bristol County with nearby schools including Mary Fonseca Elementary School, Talbot Innovation School, and B M C Durfee High School.
Ownership History
Date
Name
Owned For
Owner Type
Purchase Details
Closed on
May 13, 1988
Sold by
Cothery James E
Bought by
Goncalves Jose
Current Estimated Value
Home Financials for this Owner
Home Financials are based on the most recent Mortgage that was taken out on this home.
Original Mortgage
$105,000
Interest Rate
10.02%
Mortgage Type
Purchase Money Mortgage
Create a Home Valuation Report for This Property
The Home Valuation Report is an in-depth analysis detailing your home's value as well as a comparison with similar homes in the area
Home Values in the Area
Average Home Value in this Area
Purchase History
| Date | Buyer | Sale Price | Title Company |
|---|---|---|---|
| Goncalves Jose | $132,000 | -- |
Source: Public Records
Mortgage History
| Date | Status | Borrower | Loan Amount |
|---|---|---|---|
| Closed | Goncalves Jose | $86,200 | |
| Closed | Goncalves Jose | $5,000 | |
| Closed | Goncalves Jose | $105,000 |
Source: Public Records
Tax History
| Year | Tax Paid | Tax Assessment Tax Assessment Total Assessment is a certain percentage of the fair market value that is determined by local assessors to be the total taxable value of land and additions on the property. | Land | Improvement |
|---|---|---|---|---|
| 2025 | $5,159 | $450,600 | $105,500 | $345,100 |
| 2024 | $4,935 | $429,500 | $101,600 | $327,900 |
| 2023 | $4,312 | $351,400 | $84,000 | $267,400 |
| 2022 | $3,848 | $304,900 | $80,000 | $224,900 |
| 2021 | $3,655 | $264,300 | $76,100 | $188,200 |
| 2020 | $3,312 | $229,200 | $75,000 | $154,200 |
| 2019 | $2,839 | $194,700 | $72,200 | $122,500 |
| 2018 | $2,610 | $178,500 | $78,200 | $100,300 |
| 2017 | $2,447 | $174,800 | $74,500 | $100,300 |
| 2016 | $2,414 | $177,100 | $79,300 | $97,800 |
| 2015 | $2,319 | $177,300 | $79,300 | $98,000 |
| 2014 | $2,316 | $184,100 | $77,000 | $107,100 |
Source: Public Records
Map
Nearby Homes
- 70 Jencks St
- 88 Harrison St Unit 5
- 178 Thomas St
- 1244 Pleasant St
- 165 Eastern Ave
- 150 Downing St
- 1155-1157 Pleasant St
- 580 County St
- 129 County St
- 529 Eastern Ave
- 152 Alden St
- 10 Carlisa Dr
- 25 Lebanon St Unit D
- 25 Lebanon St Unit C
- 31 Choate St
- 756 County St
- 847 Pleasant St
- 139 Quarry St
- 84 Healy St
- 144 Choate St
- 28 Thomas St
- 28 Thomas St Unit 3
- 393 County St
- 2 Thomas St Unit 3N
- 2 Thomas St Unit 3 South
- 2 Thomas St Unit 2 North
- 2 Thomas St
- 2 Thomas St Unit 2
- 10 Thomas St Unit 3 South
- 10 Thomas St Unit 2 South
- 10 Thomas St Unit 2S
- 10 Thomas St Unit 1 South
- 367 County St
- 38 Thomas St
- 25 Mason St
- 13 Mason St
- 13 Mason St
- 25 Thomas St
- 357 County St
- 41 Mason St
Your Personal Tour Guide
Ask me questions while you tour the home.