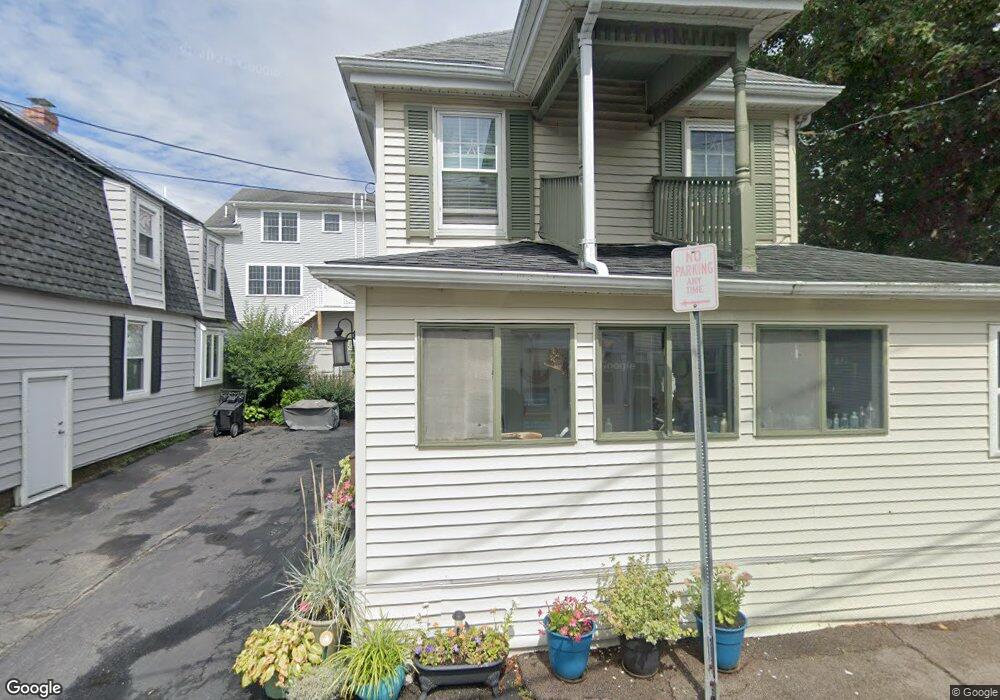
16 Thomas St Quincy, MA 02169
Houghs Neck NeighborhoodEstimated Value: $489,669 - $558,000
3
Beds
1
Bath
984
Sq Ft
$540/Sq Ft
Est. Value
About This Home
This home is located at 16 Thomas St, Quincy, MA 02169 and is currently estimated at $531,667, approximately $540 per square foot. 16 Thomas St is a home located in Norfolk County with nearby schools including Atherton Hough Elementary School, Broad Meadows Middle School, and Quincy High School.
Ownership History
Date
Name
Owned For
Owner Type
Purchase Details
Closed on
Feb 20, 1996
Sold by
Quincy Ngbhd Hsg Svcs
Bought by
Keating M Christine
Current Estimated Value
Home Financials for this Owner
Home Financials are based on the most recent Mortgage that was taken out on this home.
Original Mortgage
$55,000
Outstanding Balance
$1,441
Interest Rate
6.99%
Mortgage Type
Purchase Money Mortgage
Estimated Equity
$530,226
Purchase Details
Closed on
Mar 23, 1995
Sold by
Colonial Fsb
Bought by
Quincy Housing Svc Inc
Home Financials for this Owner
Home Financials are based on the most recent Mortgage that was taken out on this home.
Original Mortgage
$50,000
Interest Rate
8.78%
Mortgage Type
Purchase Money Mortgage
Purchase Details
Closed on
Jul 25, 1994
Sold by
Est Picard John P
Bought by
Colonial Fsb
Create a Home Valuation Report for This Property
The Home Valuation Report is an in-depth analysis detailing your home's value as well as a comparison with similar homes in the area
Home Values in the Area
Average Home Value in this Area
Purchase History
| Date | Buyer | Sale Price | Title Company |
|---|---|---|---|
| Keating M Christine | $55,000 | -- | |
| Quincy Housing Svc Inc | $50,000 | -- | |
| Colonial Fsb | $60,000 | -- |
Source: Public Records
Mortgage History
| Date | Status | Borrower | Loan Amount |
|---|---|---|---|
| Open | Colonial Fsb | $55,000 | |
| Previous Owner | Colonial Fsb | $50,000 | |
| Previous Owner | Colonial Fsb | $60,000 |
Source: Public Records
Tax History
| Year | Tax Paid | Tax Assessment Tax Assessment Total Assessment is a certain percentage of the fair market value that is determined by local assessors to be the total taxable value of land and additions on the property. | Land | Improvement |
|---|---|---|---|---|
| 2025 | $5,431 | $471,000 | $263,900 | $207,100 |
| 2024 | $4,990 | $442,800 | $239,900 | $202,900 |
| 2023 | $4,525 | $406,600 | $218,100 | $188,500 |
| 2022 | $4,182 | $349,100 | $181,700 | $167,400 |
| 2021 | $4,165 | $343,100 | $181,700 | $161,400 |
| 2020 | $3,991 | $321,100 | $181,700 | $139,400 |
| 2019 | $4,017 | $320,100 | $187,300 | $132,800 |
| 2018 | $3,806 | $285,300 | $162,900 | $122,400 |
| 2017 | $3,949 | $278,700 | $168,000 | $110,700 |
| 2016 | $3,699 | $257,600 | $152,700 | $104,900 |
| 2015 | $3,511 | $240,500 | $144,600 | $95,900 |
| 2014 | $3,404 | $229,100 | $139,200 | $89,900 |
Source: Public Records
Map
Nearby Homes
- 12 Thomas St
- 10 Thomas St
- 10 Harveys Ln
- 6 Harveys Ln Unit B
- 6 Harveys Ln
- 18 Thomas St
- 20 Thomas St
- 19 Thomas St
- 13 Thomas St
- 8 Harveys Ln
- 15 Thomas St
- 1241 Sea St Unit C
- 21 Thomas St Unit 205-2
- 21 Thomas St Unit 205-1
- 2 Harveys Ln Unit A
- 2 Harveys Ln
- 2 Harveys Ln Unit 2B
- 1241A Sea St
- 1229 Sea St Unit 1
- 1231 Sea St Unit 1
Your Personal Tour Guide
Ask me questions while you tour the home.