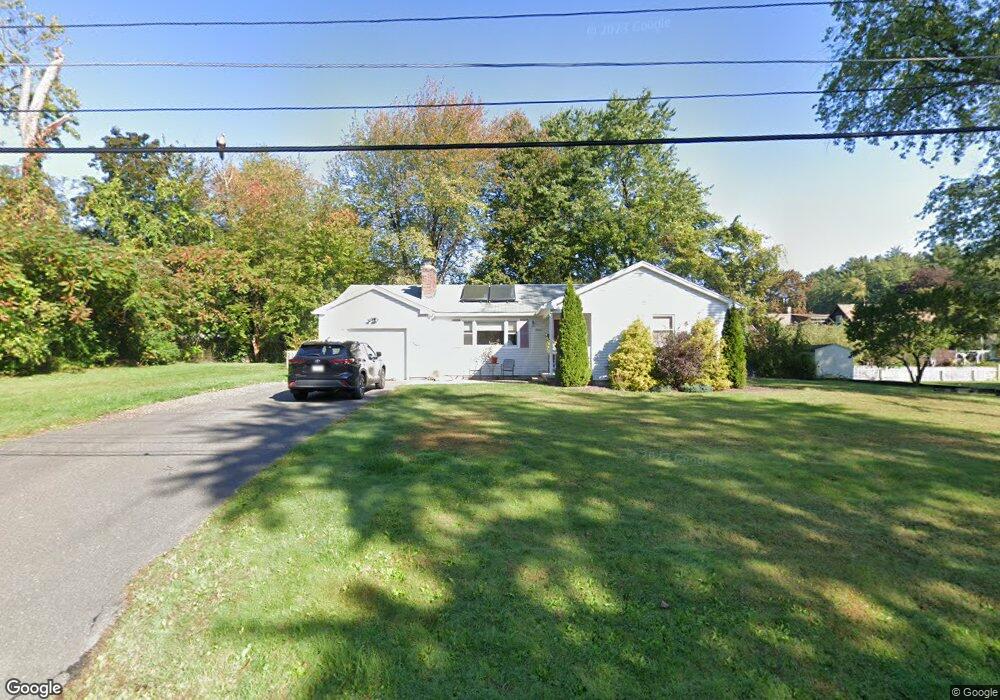
16 Thompson St West Springfield, MA 01089
Estimated Value: $295,000 - $380,000
3
Beds
1
Bath
1,128
Sq Ft
$294/Sq Ft
Est. Value
About This Home
This home is located at 16 Thompson St, West Springfield, MA 01089 and is currently estimated at $331,280, approximately $293 per square foot. 16 Thompson St is a home located in Hampden County with nearby schools including St Thomas The Apostle School.
Ownership History
Date
Name
Owned For
Owner Type
Purchase Details
Closed on
Sep 16, 2002
Sold by
Twaddle John P and Twaddle Lorri A
Bought by
Parent Christopher R
Current Estimated Value
Home Financials for this Owner
Home Financials are based on the most recent Mortgage that was taken out on this home.
Original Mortgage
$125,000
Outstanding Balance
$53,130
Interest Rate
6.48%
Mortgage Type
Purchase Money Mortgage
Estimated Equity
$278,150
Purchase Details
Closed on
Nov 13, 1992
Sold by
Tucker Walter R and Tucker Linda J
Bought by
Twaddle John P and Twaddle Lorri A
Create a Home Valuation Report for This Property
The Home Valuation Report is an in-depth analysis detailing your home's value as well as a comparison with similar homes in the area
Home Values in the Area
Average Home Value in this Area
Purchase History
| Date | Buyer | Sale Price | Title Company |
|---|---|---|---|
| Parent Christopher R | $165,000 | -- | |
| Twaddle John P | $119,000 | -- |
Source: Public Records
Mortgage History
| Date | Status | Borrower | Loan Amount |
|---|---|---|---|
| Open | Twaddle John P | $125,000 | |
| Previous Owner | Twaddle John P | $128,700 |
Source: Public Records
Tax History Compared to Growth
Tax History
| Year | Tax Paid | Tax Assessment Tax Assessment Total Assessment is a certain percentage of the fair market value that is determined by local assessors to be the total taxable value of land and additions on the property. | Land | Improvement |
|---|---|---|---|---|
| 2025 | $3,802 | $255,700 | $111,300 | $144,400 |
| 2024 | $3,781 | $255,300 | $111,300 | $144,000 |
| 2023 | $3,653 | $235,100 | $111,300 | $123,800 |
| 2022 | $3,269 | $207,400 | $98,800 | $108,600 |
| 2021 | $3,235 | $191,400 | $91,800 | $99,600 |
| 2020 | $3,247 | $191,100 | $91,800 | $99,300 |
| 2019 | $3,241 | $191,100 | $91,800 | $99,300 |
| 2018 | $3,258 | $191,100 | $91,800 | $99,300 |
| 2017 | $3,258 | $191,100 | $91,800 | $99,300 |
| 2016 | $3,211 | $189,000 | $88,300 | $100,700 |
| 2015 | $3,147 | $185,200 | $86,500 | $98,700 |
| 2014 | $763 | $185,200 | $86,500 | $98,700 |
Source: Public Records
Map
Nearby Homes
- 180 Wolcott Ave
- 16 North St
- 260 Wolcott Ave
- 65 Verdugo St
- 32 Lotus Ave
- 148 Craiwell Ave
- 43 Houston Rd
- 139 Upper Beverly Hills
- 142 Morton St
- 42 Janet St
- 258 Poplar Ave
- 19 Cora St
- 61 Clarence St
- 36 Maple Terrace
- 74 Maple Terrace
- 416 Hillcrest Ave
- 43 Wishing Well Way
- 17 Laurence Dr
- 283 Forest Glen
- 31 Stone Path Ln
- 31 Belmont Ave
- 17 Gilbert St
- 43 Belmont Ave
- 19 Thompson St
- 11 Belmont Ave
- 16 Gilbert St
- 30 Belmont Ave
- 26 Gilbert St
- 1806 Westfield St
- 57 Belmont Ave
- 42 Belmont Ave
- 18 Belmont Ave
- 50 Belmont Ave
- 1790 Westfield St
- 23 Bascom St
- 69 Belmont Ave
- 1784 Westfield St
- 70 Belmont Ave
- 68 Rogers Ave
- 58 Rogers Ave