Estimated Value: $282,000 - $284,189
3
Beds
2
Baths
1,378
Sq Ft
$206/Sq Ft
Est. Value
About This Home
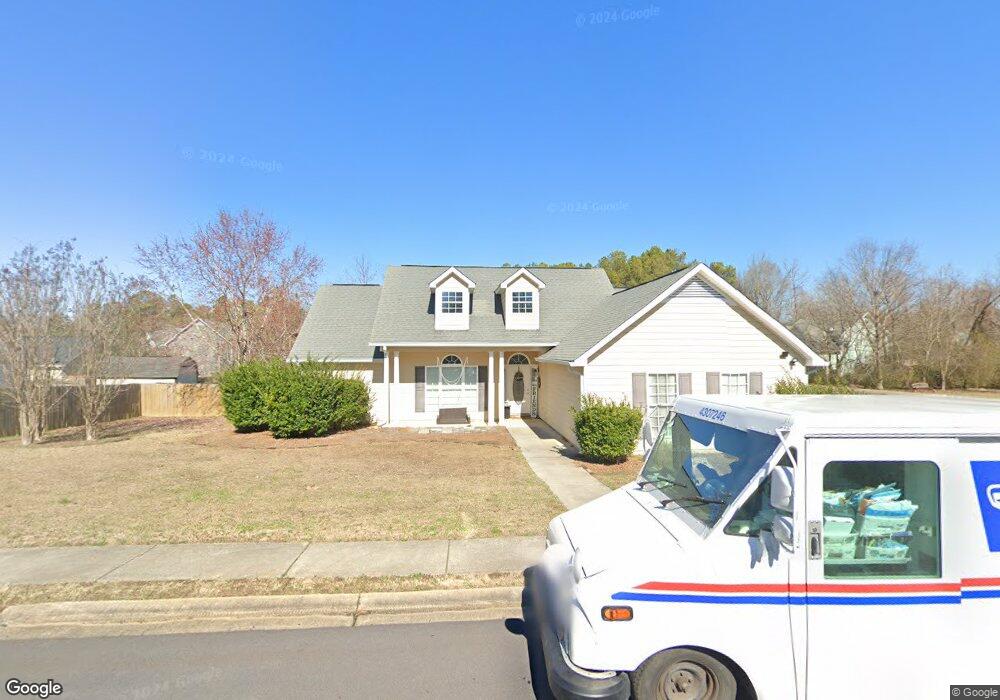
This home is located at 16 Treehouse Trail NE Unit 23, Rome, GA 30165 and is currently estimated at $283,547, approximately $205 per square foot. 16 Treehouse Trail NE Unit 23 is a home located in Floyd County with nearby schools including Armuchee Middle School, Armuchee High School, and Unity Christian School.
Ownership History
Date
Name
Owned For
Owner Type
Purchase Details
Closed on
Aug 31, 2021
Sold by
Gipson Amanda A
Bought by
Castro Jazthen Alejandro and Champion Brittany Richelle
Current Estimated Value
Home Financials for this Owner
Home Financials are based on the most recent Mortgage that was taken out on this home.
Original Mortgage
$211,105
Outstanding Balance
$191,803
Interest Rate
2.7%
Mortgage Type
FHA
Estimated Equity
$91,744
Purchase Details
Closed on
Apr 23, 2012
Sold by
Corbin David L
Bought by
Gipson Amanda A
Home Financials for this Owner
Home Financials are based on the most recent Mortgage that was taken out on this home.
Original Mortgage
$117,932
Interest Rate
3.75%
Mortgage Type
FHA
Purchase Details
Closed on
Oct 8, 2004
Bought by
P and R
Purchase Details
Closed on
Sep 28, 2004
Sold by
27 East Llc
Bought by
Corbin David L and Corbin Janice H
Purchase Details
Closed on
Apr 23, 1998
Bought by
27 East Llc
Create a Home Valuation Report for This Property
The Home Valuation Report is an in-depth analysis detailing your home's value as well as a comparison with similar homes in the area
Home Values in the Area
Average Home Value in this Area
Purchase History
| Date | Buyer | Sale Price | Title Company |
|---|---|---|---|
| Castro Jazthen Alejandro | $215,000 | -- | |
| Gipson Amanda A | $121,000 | -- | |
| P | $23,000 | -- | |
| Corbin David L | $135,000 | -- | |
| 27 East Llc | -- | -- |
Source: Public Records
Mortgage History
| Date | Status | Borrower | Loan Amount |
|---|---|---|---|
| Open | Castro Jazthen Alejandro | $211,105 | |
| Previous Owner | Gipson Amanda A | $117,932 |
Source: Public Records
Tax History Compared to Growth
Tax History
| Year | Tax Paid | Tax Assessment Tax Assessment Total Assessment is a certain percentage of the fair market value that is determined by local assessors to be the total taxable value of land and additions on the property. | Land | Improvement |
|---|---|---|---|---|
| 2024 | $3,137 | $116,132 | $10,080 | $106,052 |
| 2023 | $3,139 | $101,804 | $10,080 | $91,724 |
| 2022 | $2,625 | $87,034 | $9,600 | $77,434 |
| 2021 | $2,088 | $66,803 | $9,600 | $57,203 |
| 2020 | $1,952 | $61,895 | $9,600 | $52,295 |
| 2019 | $1,849 | $59,440 | $9,600 | $49,840 |
| 2018 | $1,706 | $54,691 | $9,600 | $45,091 |
| 2017 | $1,521 | $48,440 | $9,600 | $38,840 |
| 2016 | $1,445 | $45,307 | $9,600 | $35,707 |
| 2015 | $1,415 | $45,307 | $9,600 | $35,707 |
| 2014 | $1,415 | $45,307 | $9,600 | $35,707 |
Source: Public Records
Map
Nearby Homes
- 9 Redfern Trail NE
- 4 Glen View Dr NE
- 3158 Martha Berry Hwy
- 8 Coggins Place NE
- 631 Old Summerville Rd NW
- 637 Old Summerville Rd NW
- 9 Coggins Place NE
- 10 Coggins Place NE
- 12 Coggins Place NE
- BELHAVEN Plan at Northberry
- CALI Plan at Northberry
- ARIA Plan at Northberry
- KERRY Plan at Northberry
- ROBIE Plan at Northberry
- 13 Coggins Place NE
- 7 Orr St NE
- 87 Selman Rd NW
- 1 Babcock Dr NE
- 27 Coggins Place NE
- 29 Coggins Place NE
- 16 Treehouse Trail NE
- 7 Split Branch Ct NE
- 18 Treehouse Trail NE
- 6 Split Branch Ct NE
- 15 Treehouse Trail NE
- 4 Foliage Way NE
- 17 Treehouse Trail NE
- 8 Split Branch Ct NE
- 6 Foliage Way NE
- 9 Split Branch Ct NE
- 20 Treehouse Trail NE
- 19 Treehouse Trail NE
- 11 Split Branch Ct NE
- 13 Treehouse Trail NE
- 10 Split Branch Ct NE
- 26 Honeytree Trail NE
- 21 Treehouse Trail NE
- 11 Treehouse Trail NE
- 24 Honeytree Trail NE
- 23 Treehouse Trail NE