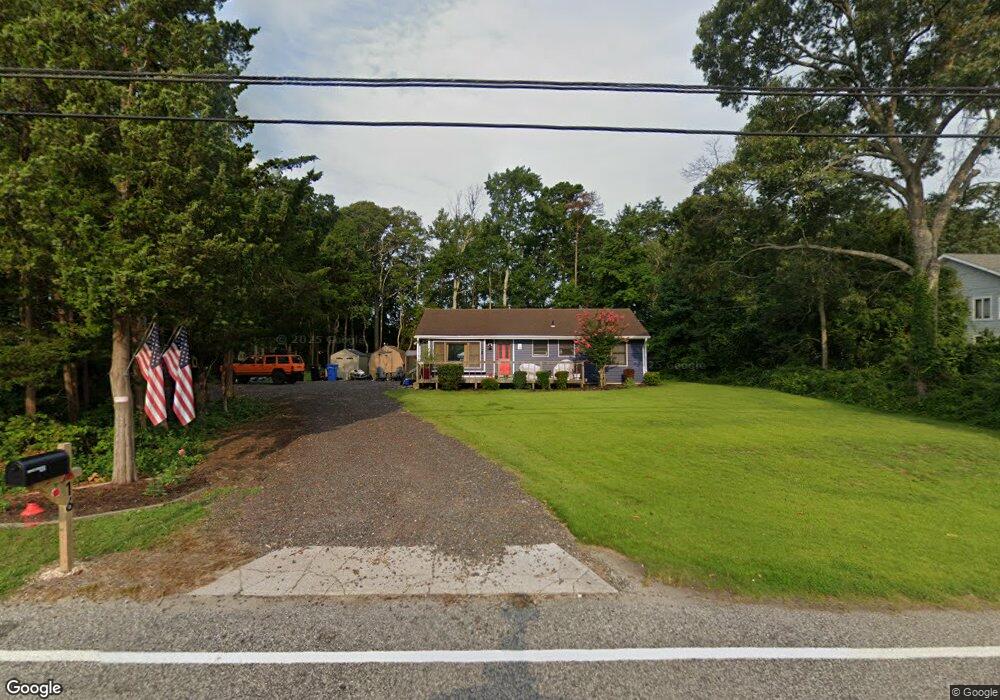
16 Tyler Rd Ocean View, NJ 08230
Estimated Value: $401,441
--
Bed
--
Bath
1,008
Sq Ft
$398/Sq Ft
Est. Value
About This Home
This home is located at 16 Tyler Rd, Ocean View, NJ 08230 and is currently estimated at $401,441, approximately $398 per square foot. 16 Tyler Rd is a home located in Cape May County with nearby schools including Upper Township Primary School, Upper Township Elementary School, and Upper Township Middle School.
Ownership History
Date
Name
Owned For
Owner Type
Purchase Details
Closed on
Dec 29, 2022
Sold by
Breunig Veronica
Bought by
Bailey Jonathan
Current Estimated Value
Home Financials for this Owner
Home Financials are based on the most recent Mortgage that was taken out on this home.
Original Mortgage
$270,000
Outstanding Balance
$261,619
Interest Rate
6.58%
Mortgage Type
VA
Estimated Equity
$146,397
Purchase Details
Closed on
Jun 16, 2016
Sold by
Breunig Robert H and Breunig Veronica
Bought by
Breunig Veronica
Purchase Details
Closed on
Aug 11, 2005
Sold by
Breunig Robert H
Bought by
Breunig Robert H and Breunig Veronica
Home Financials for this Owner
Home Financials are based on the most recent Mortgage that was taken out on this home.
Original Mortgage
$176,250
Interest Rate
5.92%
Mortgage Type
New Conventional
Create a Home Valuation Report for This Property
The Home Valuation Report is an in-depth analysis detailing your home's value as well as a comparison with similar homes in the area
Home Values in the Area
Average Home Value in this Area
Purchase History
| Date | Buyer | Sale Price | Title Company |
|---|---|---|---|
| Bailey Jonathan | $335,000 | Shore Title | |
| Breunig Veronica | -- | None Available | |
| Breunig Robert H | -- | Group 21 Title Agency |
Source: Public Records
Mortgage History
| Date | Status | Borrower | Loan Amount |
|---|---|---|---|
| Open | Bailey Jonathan | $270,000 | |
| Previous Owner | Breunig Robert H | $176,250 |
Source: Public Records
Tax History Compared to Growth
Tax History
| Year | Tax Paid | Tax Assessment Tax Assessment Total Assessment is a certain percentage of the fair market value that is determined by local assessors to be the total taxable value of land and additions on the property. | Land | Improvement |
|---|---|---|---|---|
| 2025 | $3,781 | $173,300 | $103,500 | $69,800 |
| 2024 | $3,781 | $173,300 | $103,500 | $69,800 |
| 2023 | $3,781 | $173,300 | $103,500 | $69,800 |
| 2022 | $3,655 | $173,300 | $103,500 | $69,800 |
| 2021 | $2,612 | $173,300 | $103,500 | $69,800 |
| 2020 | $3,393 | $173,300 | $103,500 | $69,800 |
| 2019 | $3,312 | $173,300 | $103,500 | $69,800 |
| 2018 | $3,227 | $173,300 | $103,500 | $69,800 |
| 2017 | $3,190 | $173,300 | $103,500 | $69,800 |
| 2016 | $2,983 | $159,500 | $103,500 | $56,000 |
| 2015 | $2,905 | $159,500 | $103,500 | $56,000 |
| 2014 | $2,870 | $193,000 | $131,200 | $61,800 |
Source: Public Records
Map
Nearby Homes
- 10 New Jersey 50
- 127 Route 50
- 78 Tyler Rd
- 1431 Stagecoach Rd
- 49 Hope Corson Rd
- 86 Route 50
- 3 Sandcastle Dr
- 11 Laurel Ridge Rd
- 4 Sandcastle Dr
- 81 Flounder
- 1729 Shore Rd
- 16 Winchester Ct
- 14 Winchester Ct
- 1340 U S 9
- 13 Mooring Cir
- 3 Kruk Terrace
- 5 Kruk Terrace
- 4 W Katherine Ave
- 1731 Route 9 Unit 28
- 2058 U S 9