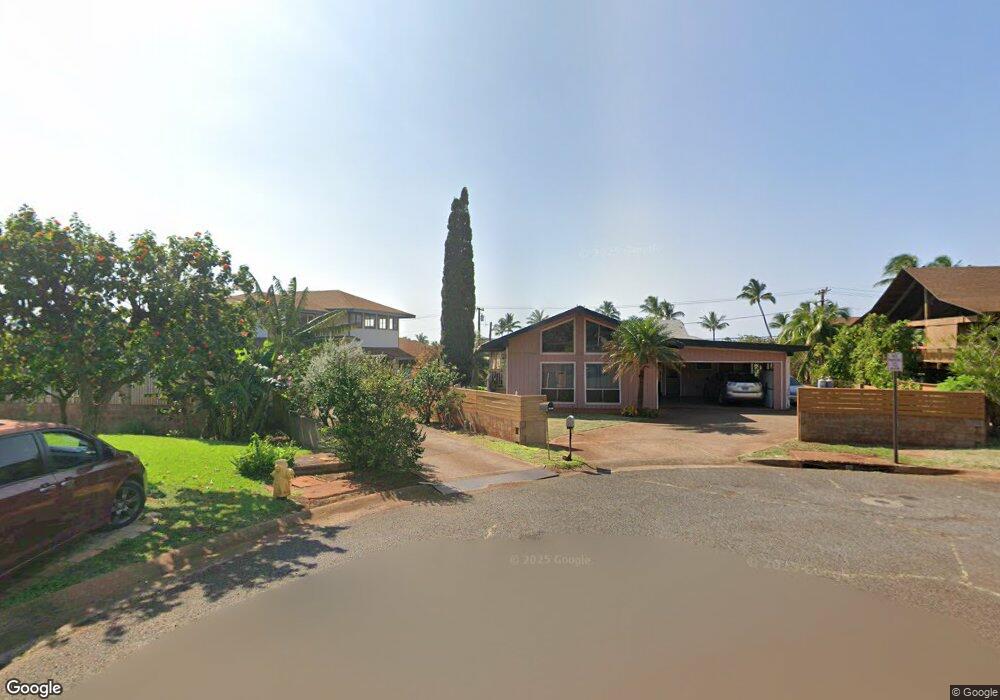
16 Uli Place Lahaina, HI 96761
Estimated Value: $1,602,000 - $1,904,000
7
Beds
4
Baths
1,656
Sq Ft
$1,058/Sq Ft
Est. Value
About This Home
This home is located at 16 Uli Place, Lahaina, HI 96761 and is currently estimated at $1,752,695, approximately $1,058 per square foot. 16 Uli Place is a home located in Maui County with nearby schools including King Kamehameha III Elementary School, Lāhainā Intermediate School, and Lahainaluna High School.
Ownership History
Date
Name
Owned For
Owner Type
Purchase Details
Closed on
Feb 24, 2020
Sold by
Tumpap Virgilio A
Bought by
Koyanagi Roseville T and Tumpap Virgilio A
Current Estimated Value
Purchase Details
Closed on
Jun 2, 2011
Sold by
Tumpap Virgilio
Bought by
Tumpap Virgilio A and Virgilio A Tumpap Jr Trust
Purchase Details
Closed on
Jul 6, 2010
Sold by
Lazarevic Rosita G and Tumpap Rosita G
Bought by
Koyanagi Roseville Tumpap and Koyanagi Craig Akio
Purchase Details
Closed on
Oct 28, 2002
Sold by
Makekau Stanley N B and Makekau Stanley
Bought by
Makekau Jeffery N
Purchase Details
Closed on
May 2, 2002
Sold by
Lazarevic Rosita and Tumpap Rosita
Bought by
Lazarevic Rosita G and Tumpap Virgilio
Purchase Details
Closed on
Mar 21, 2002
Sold by
Tumpap Virgilio A
Bought by
Tumpap Virgilio A and The Virgilio A Tumpap Trust
Create a Home Valuation Report for This Property
The Home Valuation Report is an in-depth analysis detailing your home's value as well as a comparison with similar homes in the area
Home Values in the Area
Average Home Value in this Area
Purchase History
| Date | Buyer | Sale Price | Title Company |
|---|---|---|---|
| Koyanagi Roseville T | -- | None Available | |
| Tumpap Virgilio A | -- | None Available | |
| Tumpap Virgilio A | -- | None Available | |
| Koyanagi Roseville Tumpap | -- | None Available | |
| Makekau Jeffery N | -- | -- | |
| Lazarevic Rosita G | -- | -- | |
| Tumpap Virgilio A | -- | -- |
Source: Public Records
Tax History Compared to Growth
Tax History
| Year | Tax Paid | Tax Assessment Tax Assessment Total Assessment is a certain percentage of the fair market value that is determined by local assessors to be the total taxable value of land and additions on the property. | Land | Improvement |
|---|---|---|---|---|
| 2025 | $1,481 | $1,178,600 | $758,200 | $420,400 |
| 2024 | $1,481 | $1,122,600 | $720,300 | $402,300 |
| 2023 | $1,423 | $1,048,700 | $644,500 | $404,200 |
| 2022 | $5,391 | $921,600 | $553,500 | $368,100 |
| 2021 | $4,983 | $903,000 | $553,500 | $349,500 |
| 2020 | $1,771 | $905,500 | $553,500 | $352,000 |
| 2019 | $1,734 | $797,900 | $454,900 | $343,000 |
| 2018 | $1,692 | $793,600 | $409,400 | $384,200 |
| 2017 | $1,534 | $0 | $0 | $0 |
| 2016 | $1,364 | $705,200 | $348,800 | $356,400 |
| 2015 | $716 | $672,000 | $348,800 | $323,200 |
Source: Public Records
Map
Nearby Homes
- 3959 Lower Honoapiilani Rd Unit 205
- 3959 Lower Honoapiilani Rd Unit 310
- 3959 Lower Honoapiilani Rd Unit 503
- 3959 Lower Honoapiilani Rd Unit 304
- 3975 Lower Honoapiilani Rd Unit 221
- 24 Olali St
- 4007 Lower Honoapiilani Rd Unit 114
- 3875 Lower Honoapiilani Rd Unit B402
- 3875 Lower Honoapiilani Rd Unit B205
- 3875 Lower Honoapiilani Rd Unit A104
- 3875 Lower Honoapiilani Rd Unit A206
- 3875 Lower Honoapiilani Rd Unit B-306
- 3875 Lower Honoapiilani Rd Unit A207
- 3875 Lower Honoapiilani Rd Unit B204
- 3875 Lower Honoapiilani Rd Unit A-401
- 3875 Lower Honoapiilani Rd Unit B305
- 3863 Mahinahina St
- 4038 Mahinahina Place
- 4057 Lower Honoapiilani Rd Unit 121
- 4057 Lower Honoapiilani Rd Unit 114
- 20 Uli Place
- 21 Uli Place
- 3959 Lower Honoapiilani Rd Kuleana II Unit 314
- 3875 L Honoapiilani Rd Unit C
- 3875 L Honoapiilani Rd Unit B406
- 3875 L Honoapiilani Rd Unit B405
- 3875 L Honoapiilani Rd Unit B404
- 3875 L Honoapiilani Rd Unit B403
- 3875 L Honoapiilani Rd Unit B402
- 3875 L Honoapiilani Rd Unit B401
- 3875 L Honoapiilani Rd Unit B306
- 3875 L Honoapiilani Rd Unit B305
- 3875 L Honoapiilani Rd Unit B304
- 3875 L Honoapiilani Rd Unit B303
- 3875 L Honoapiilani Rd Unit B302
- 3875 L Honoapiilani Rd Unit B301
- 3875 L Honoapiilani Rd Unit B206
- 3875 L Honoapiilani Rd Unit B205
- 3875 L Honoapiilani Rd Unit B204
- 3875 L Honoapiilani Rd Unit B203