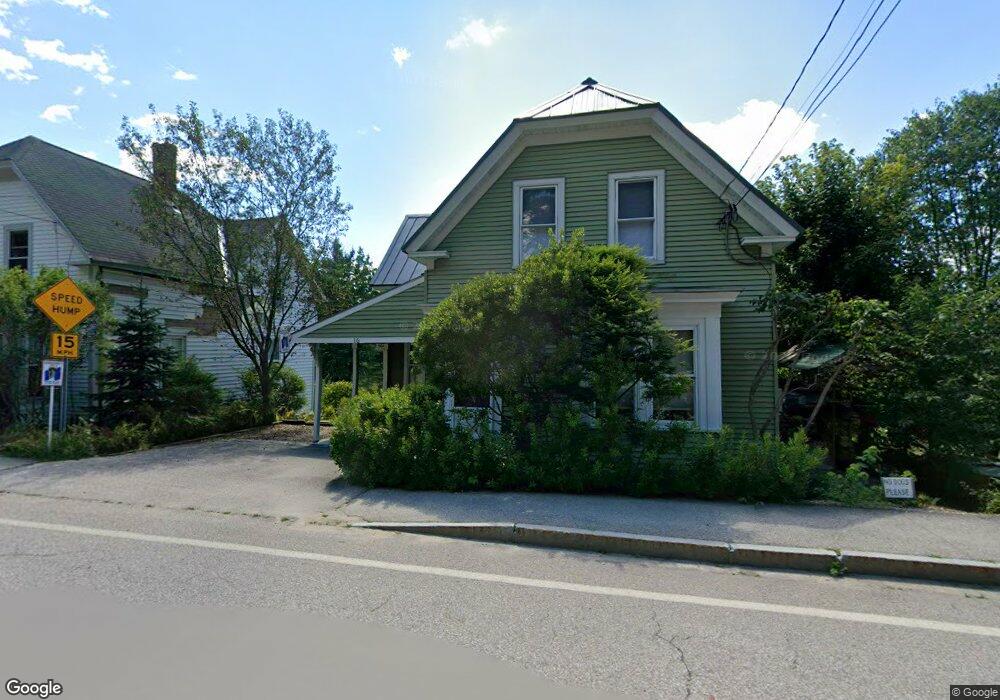
16 Union St Peterborough, NH 03458
Estimated Value: $359,424 - $469,000
2
Beds
2
Baths
1,407
Sq Ft
$288/Sq Ft
Est. Value
About This Home
This home is located at 16 Union St, Peterborough, NH 03458 and is currently estimated at $404,856, approximately $287 per square foot. 16 Union St is a home with nearby schools including Peterborough Elementary School, South Meadow School, and Conval Regional High School.
Ownership History
Date
Name
Owned For
Owner Type
Purchase Details
Closed on
Jan 3, 2002
Sold by
Graves Ann
Bought by
Wood Robert
Current Estimated Value
Home Financials for this Owner
Home Financials are based on the most recent Mortgage that was taken out on this home.
Original Mortgage
$105,600
Interest Rate
6.72%
Mortgage Type
Purchase Money Mortgage
Purchase Details
Closed on
Mar 2, 1998
Sold by
Sargent Est Carolyn B
Bought by
Graves Ann
Home Financials for this Owner
Home Financials are based on the most recent Mortgage that was taken out on this home.
Original Mortgage
$51,200
Interest Rate
6.85%
Mortgage Type
Purchase Money Mortgage
Create a Home Valuation Report for This Property
The Home Valuation Report is an in-depth analysis detailing your home's value as well as a comparison with similar homes in the area
Home Values in the Area
Average Home Value in this Area
Purchase History
| Date | Buyer | Sale Price | Title Company |
|---|---|---|---|
| Wood Robert | $132,000 | -- | |
| Graves Ann | $64,000 | -- | |
| Wood Robert Timothy | $132,000 | -- | |
| Graves Ann E | $64,000 | -- |
Source: Public Records
Mortgage History
| Date | Status | Borrower | Loan Amount |
|---|---|---|---|
| Open | Graves Ann E | $90,000 | |
| Closed | Graves Ann E | $105,600 | |
| Previous Owner | Graves Ann E | $51,200 |
Source: Public Records
Tax History
| Year | Tax Paid | Tax Assessment Tax Assessment Total Assessment is a certain percentage of the fair market value that is determined by local assessors to be the total taxable value of land and additions on the property. | Land | Improvement |
|---|---|---|---|---|
| 2025 | $7,829 | $240,900 | $75,700 | $165,200 |
| 2024 | $7,829 | $240,900 | $75,700 | $165,200 |
| 2023 | $6,791 | $240,900 | $75,700 | $165,200 |
| 2022 | $6,230 | $240,900 | $75,700 | $165,200 |
| 2021 | $6,206 | $240,900 | $75,700 | $165,200 |
| 2020 | $5,644 | $183,000 | $49,900 | $133,100 |
| 2019 | $5,444 | $183,000 | $49,900 | $133,100 |
| 2018 | $5,506 | $183,000 | $49,900 | $133,100 |
| 2017 | $4,599 | $146,200 | $49,900 | $96,300 |
| 2016 | $4,509 | $146,200 | $49,900 | $96,300 |
| 2015 | $4,341 | $146,100 | $49,900 | $96,200 |
Source: Public Records
Map
Nearby Homes
Your Personal Tour Guide
Ask me questions while you tour the home.