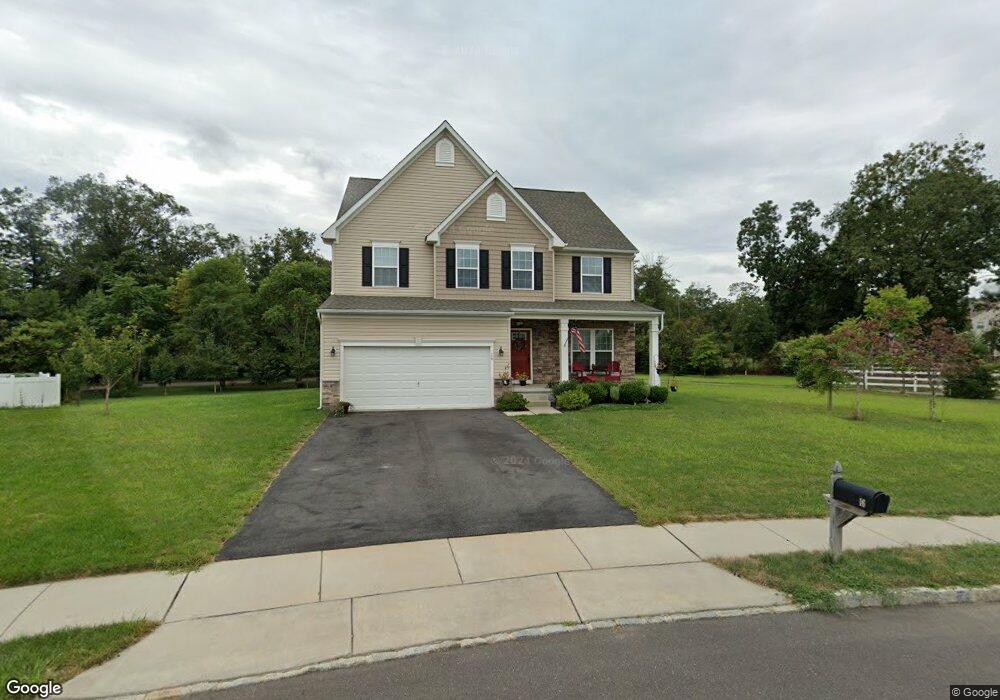
16 Vaughn Way Burlington, NJ 08016
Estimated Value: $690,714 - $862,000
--
Bed
--
Bath
3,250
Sq Ft
$235/Sq Ft
Est. Value
About This Home
This home is located at 16 Vaughn Way, Burlington, NJ 08016 and is currently estimated at $764,929, approximately $235 per square foot. 16 Vaughn Way is a home with nearby schools including B Bernice Young Elementary School, Fountain Woods Elementary School, and Burlington Township Middle School at Springside.
Ownership History
Date
Name
Owned For
Owner Type
Purchase Details
Closed on
Oct 16, 2014
Sold by
Nvr Inc
Bought by
Sharp Laurie M and Sharp James A
Current Estimated Value
Home Financials for this Owner
Home Financials are based on the most recent Mortgage that was taken out on this home.
Original Mortgage
$346,920
Outstanding Balance
$267,037
Interest Rate
4.21%
Mortgage Type
New Conventional
Estimated Equity
$497,892
Purchase Details
Closed on
Jul 2, 2014
Sold by
Dkr Holdings Llc
Bought by
Nvr Inc and Ryan Homes
Create a Home Valuation Report for This Property
The Home Valuation Report is an in-depth analysis detailing your home's value as well as a comparison with similar homes in the area
Home Values in the Area
Average Home Value in this Area
Purchase History
| Date | Buyer | Sale Price | Title Company |
|---|---|---|---|
| Sharp Laurie M | $462,560 | Legacy Title Agency | |
| Nvr Inc | $118,250 | Title America Agency Corp |
Source: Public Records
Mortgage History
| Date | Status | Borrower | Loan Amount |
|---|---|---|---|
| Open | Sharp Laurie M | $346,920 |
Source: Public Records
Tax History Compared to Growth
Tax History
| Year | Tax Paid | Tax Assessment Tax Assessment Total Assessment is a certain percentage of the fair market value that is determined by local assessors to be the total taxable value of land and additions on the property. | Land | Improvement |
|---|---|---|---|---|
| 2025 | $12,865 | $424,300 | $84,200 | $340,100 |
| 2024 | $12,674 | $424,300 | $84,200 | $340,100 |
| 2023 | $12,674 | $424,300 | $84,200 | $340,100 |
| 2022 | $12,619 | $424,300 | $84,200 | $340,100 |
| 2021 | $12,496 | $424,300 | $84,200 | $340,100 |
| 2020 | $12,716 | $424,300 | $84,200 | $340,100 |
| 2019 | $12,746 | $424,300 | $84,200 | $340,100 |
| 2018 | $12,555 | $424,300 | $84,200 | $340,100 |
| 2017 | $12,229 | $424,300 | $84,200 | $340,100 |
| 2016 | $14,157 | $471,900 | $73,000 | $398,900 |
| 2015 | $13,912 | $25,000 | $25,000 | $0 |
| 2014 | $710 | $25,000 | $25,000 | $0 |
Source: Public Records
Map
Nearby Homes