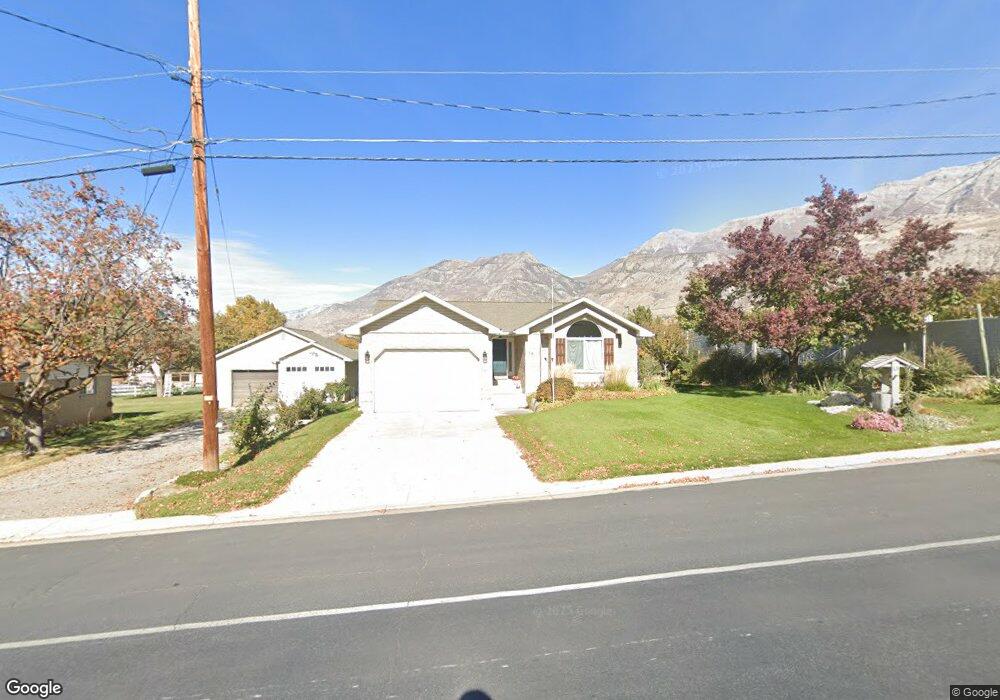
16 W 400 N Lindon, UT 84042
Estimated Value: $674,000 - $785,000
4
Beds
3
Baths
2,952
Sq Ft
$250/Sq Ft
Est. Value
About This Home
This home is located at 16 W 400 N, Lindon, UT 84042 and is currently estimated at $738,154, approximately $250 per square foot. 16 W 400 N is a home located in Utah County with nearby schools including Lindon Elementary School, Oak Canyon Junior High School, and Pleasant Grove High School.
Ownership History
Date
Name
Owned For
Owner Type
Purchase Details
Closed on
Jan 4, 2023
Sold by
Larsen Clair M and Larsen Patricia B
Bought by
Clair And Patricia Larsen Living Trust and Larsen
Current Estimated Value
Home Financials for this Owner
Home Financials are based on the most recent Mortgage that was taken out on this home.
Original Mortgage
$495,000
Interest Rate
6.39%
Mortgage Type
New Conventional
Create a Home Valuation Report for This Property
The Home Valuation Report is an in-depth analysis detailing your home's value as well as a comparison with similar homes in the area
Home Values in the Area
Average Home Value in this Area
Purchase History
| Date | Buyer | Sale Price | Title Company |
|---|---|---|---|
| Clair And Patricia Larsen Living Trust | -- | None Listed On Document | |
| Boyer David R | -- | None Listed On Document |
Source: Public Records
Mortgage History
| Date | Status | Borrower | Loan Amount |
|---|---|---|---|
| Previous Owner | Boyer David R | $495,000 |
Source: Public Records
Tax History Compared to Growth
Tax History
| Year | Tax Paid | Tax Assessment Tax Assessment Total Assessment is a certain percentage of the fair market value that is determined by local assessors to be the total taxable value of land and additions on the property. | Land | Improvement |
|---|---|---|---|---|
| 2025 | $2,957 | $388,520 | $339,000 | $367,400 |
| 2024 | $2,957 | $364,485 | $0 | $0 |
| 2023 | $2,579 | $341,440 | $0 | $0 |
| 2022 | $2,701 | $345,455 | $0 | $0 |
| 2021 | $2,287 | $441,100 | $212,900 | $228,200 |
| 2020 | $2,135 | $405,400 | $190,100 | $215,300 |
| 2019 | $1,805 | $357,600 | $162,900 | $194,700 |
| 2018 | $1,682 | $314,100 | $144,800 | $169,300 |
| 2017 | $1,480 | $148,170 | $0 | $0 |
| 2016 | $1,405 | $130,130 | $0 | $0 |
| 2015 | $1,486 | $130,130 | $0 | $0 |
| 2014 | $1,280 | $110,990 | $0 | $0 |
Source: Public Records
Map
Nearby Homes