16 W Cove Dr Newnan, GA 30263
Lake Redwine NeighborhoodEstimated payment $4,990/month
Highlights
- Marina
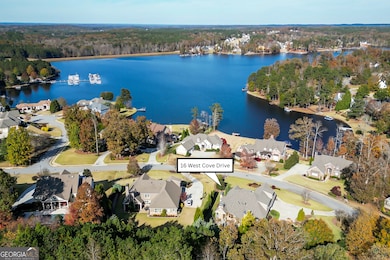
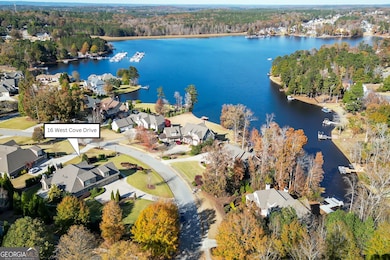
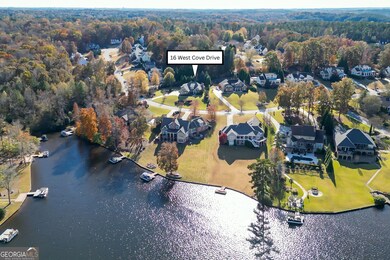
- Lake View
- Community Lake
- Brooks Elementary School Rated A
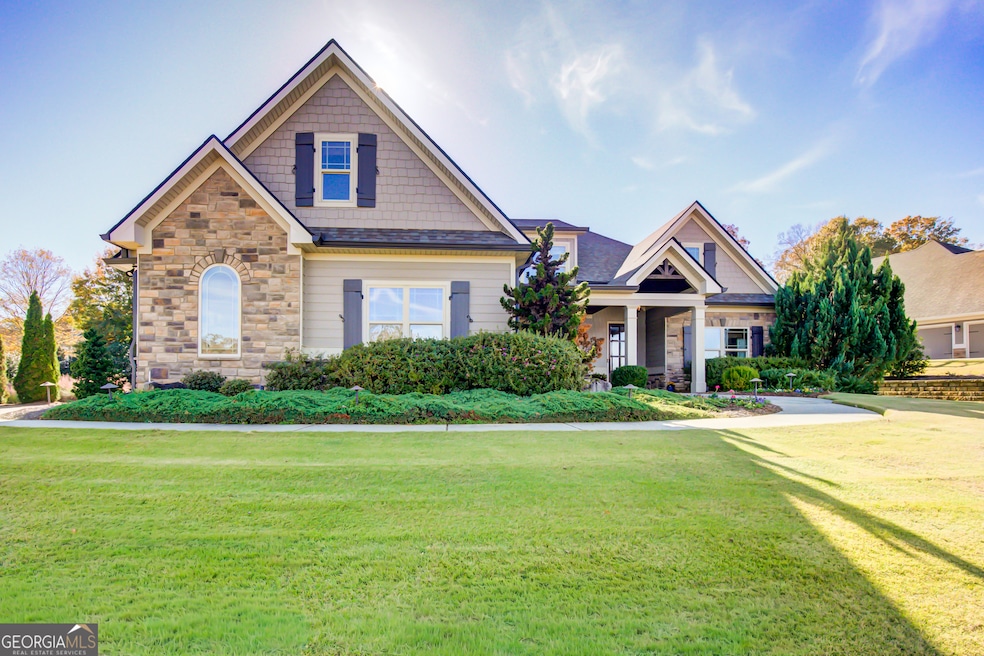
- Craftsman Architecture
- Dining Room Seats More Than Twelve
About This Home
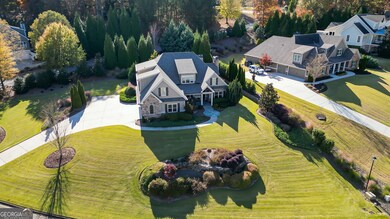
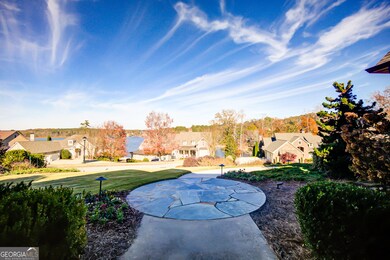
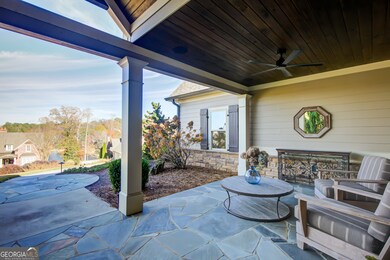
Welcome Home To 16 W Cove Drive-Where Timeless Elegance Meets Warm Southern Hospitality*Perfectly Positioned To Take In Stunning Lake Views,This Custom-Crafted 4 BR/4 Full Bath Home Offers A Lifestyle Of Comfort, Beauty And Refined Living*From The Moment You Arrive, The Home's Exceptional Curb Appeal Sets The Tone with the Stunning Lake Views*The Impressive Front Walkway with Flagstone Details Leads You To The Welcoming Front Patio- A Cozy Spot To Sit, Relax and Savor the Serene Water Views*Step Inside and Embrace the Thoughtfully Designed Layout -Perfect for Both Comfortable Everyday Living And Entertaining *Expansive Dining Room Ideal For Casual Everyday Entertaining and Holiday Gatherings With Friends And Family*Great Room Radiates Warmth With Its Stately Fireplace, Coffered Ceiling Detail-Access to Back Patio*Inviting Keeping Room With Fireplace Flows Seamlessly Into The Great Room* Spectacular Gourmet Kitchen Is The Heart Of The Home With High-End Bosch Appliances, Double Oven/Induction 5 Burner Cooktop/Built-in Wine Chiller/Microwave Drawer/Gathering Island/Custom Cabinetry Pull-Out Drawers/Loads of Prep Space/Coffee Niche/ Stylish Backsplash,/Under-Cabinet Lighting/Spacious Walk-In Pantry*Peaceful Owner's Retreat on Main with Tray Ceiling and Spa Bath Showcasing Custom Marble Tile/ Soaking Tub/Dual Vanities/Water Closet/Luxurious Walk-In Shower With Dual Shower Heads*Office/Guest Suite on Main-Full Bath* Upstairs, Two Spacious Guest Suites With 2 Full Baths*Abundant Closet Storage*Huge Bonus Room*Custom Hardwood Floors Throughout/Decorator Lighting and Paint/Whole House Speaker System and Smart Program*Lovely Covered Game Day Patio/Flagstone Terrace/Wood Burning Fireplace Is Exceptional and Designed for Outdoor Living and Enjoyment*Professionally Designed Landscape Plan Features Specimen Trees, Flowering Shrubs, Perennials, Full Irrigation, And Premium Landscape Lighting*Oversized 3 Car Garage-Epoxy Floors /Custom Cabinetry* New HVAC System (2024) And New Roof (2024)* Relish in the Lake Redwine Lifestyle*300 Acre Lake*Clubhouse*Marina*Resort-Style Amenities-Lighted Tennis/Pickleball Courts*Playground*2 Pools*Lake Fishing, Swimming*Resident Clubs and Neighborhood Events*Driving Convenience to Historic Downtown Newnan Shopping and Dining*I-85 and Hartsfield International Airport*Make 16 W Cove Drive Your Home for the Holidays!
Listing Agent
Keller Williams Realty Atl. Partners License #343457 Listed on: 11/15/2025

Home Details
Home Type
- Single Family
Est. Annual Taxes
- $6,141
Year Built
- Built in 2014
Lot Details
- 0.78 Acre Lot
- Private Lot
- Corner Lot
- Level Lot
- Sprinkler System
- Partially Wooded Lot
- Garden
- Grass Covered Lot
HOA Fees
- $100 Monthly HOA Fees
Home Design
- Craftsman Architecture
- Slab Foundation
- Composition Roof
- Concrete Siding
- Stone Siding
- Stone
Interior Spaces
- 3,645 Sq Ft Home
- 2-Story Property
- Tray Ceiling
- High Ceiling
- 3 Fireplaces
- Factory Built Fireplace
- Gas Log Fireplace
- Double Pane Windows
- Entrance Foyer
- Great Room
- Family Room
- Dining Room Seats More Than Twelve
- Formal Dining Room
- Home Office
- Bonus Room
- Lake Views
- Home Security System
Kitchen
- Breakfast Area or Nook
- Walk-In Pantry
- Built-In Double Convection Oven
- Cooktop
- Microwave
- Bosch Dishwasher
- Dishwasher
- Stainless Steel Appliances
- Kitchen Island
- Solid Surface Countertops
- Disposal
Flooring
- Wood
- Tile
Bedrooms and Bathrooms
- 4 Bedrooms | 2 Main Level Bedrooms
- Primary Bedroom on Main
- Walk-In Closet
- Double Vanity
- Soaking Tub
- Bathtub Includes Tile Surround
- Separate Shower
Laundry
- Laundry in Mud Room
- Laundry Room
- Dryer
- Washer
Parking
- 3 Car Garage
- Parking Storage or Cabinetry
- Parking Accessed On Kitchen Level
- Side or Rear Entrance to Parking
- Garage Door Opener
Outdoor Features
- Patio
- Veranda
- Porch
Schools
- Brooks Elementary School
- Madras Middle School
- Newnan High School
Utilities
- Two cooling system units
- Central Heating and Cooling System
- Dual Heating Fuel
- Heating System Uses Natural Gas
- Underground Utilities
- Tankless Water Heater
- Septic Tank
- High Speed Internet
- Cable TV Available
Community Details
Overview
- $250 Initiation Fee
- Association fees include facilities fee, management fee, swimming, tennis
- Lake Redwine Subdivision
- Community Lake
Amenities
- Clubhouse
Recreation
- Marina
- Tennis Courts
- Community Playground
- Community Pool
Map
Home Values in the Area
Average Home Value in this Area
Tax History
| Year | Tax Paid | Tax Assessment Tax Assessment Total Assessment is a certain percentage of the fair market value that is determined by local assessors to be the total taxable value of land and additions on the property. | Land | Improvement |
|---|---|---|---|---|
| 2025 | $6,843 | $308,018 | $32,000 | $276,018 |
| 2024 | $6,040 | $264,779 | $32,000 | $232,779 |
| 2023 | $6,040 | $257,417 | $32,000 | $225,417 |
| 2022 | $5,154 | $213,938 | $32,000 | $181,938 |
| 2021 | $5,024 | $195,512 | $32,000 | $163,512 |
| 2020 | $5,056 | $195,512 | $32,000 | $163,512 |
| 2019 | $5,827 | $203,890 | $34,000 | $169,890 |
| 2018 | $5,838 | $203,890 | $34,000 | $169,890 |
| 2017 | $5,578 | $195,081 | $34,000 | $161,081 |
| 2016 | $5,294 | $187,530 | $34,000 | $153,530 |
| 2015 | $4,681 | $164,429 | $26,000 | $138,429 |
| 2014 | $551 | $19,500 | $19,500 | $0 |
Property History
| Date | Event | Price | List to Sale | Price per Sq Ft |
|---|---|---|---|---|
| 11/15/2025 11/15/25 | For Sale | $829,000 | -- | $227 / Sq Ft |
Purchase History
| Date | Type | Sale Price | Title Company |
|---|---|---|---|
| Warranty Deed | $610,059 | -- | |
| Warranty Deed | $58,000 | -- | |
| Warranty Deed | $58,000 | -- | |
| Deed | -- | -- | |
| Deed | -- | -- |
Mortgage History
| Date | Status | Loan Amount | Loan Type |
|---|---|---|---|
| Open | $200,000 | New Conventional | |
| Previous Owner | $336,000 | New Conventional |
Source: Georgia MLS
MLS Number: 10644534
APN: 071-5184-142
Disclaimer: Certain information contained herein is derived from information provided by parties other than Homes.com. All information provided is deemed reliable, but is not guaranteed to be accurate and should be independently verified.
![]() The data relating to real estate for sale on this web site comes in part from the Broker Reciprocity Program of Georgia MLS. Real estate listings held by brokerage firms other than Redfin are marked with the Broker Reciprocity logo and detailed information about them includes the name of the listing brokers. Information deemed reliable but not guaranteed. Copyright 2025 Georgia MLS. All rights reserved.
The data relating to real estate for sale on this web site comes in part from the Broker Reciprocity Program of Georgia MLS. Real estate listings held by brokerage firms other than Redfin are marked with the Broker Reciprocity logo and detailed information about them includes the name of the listing brokers. Information deemed reliable but not guaranteed. Copyright 2025 Georgia MLS. All rights reserved.
- 285 Peninsula Cir
- 134 W Cove Dr
- 330 Peninsula Dr
- 25 The Terrace
- 90 Westwind Dr
- 894 Happy Valley Cir
- 62 N Shore at Redwine Dr
- 50 Peninsula Cir
- 214 Westwind Dr
- 212 Westwind Dr
- 264 Kendall St
- 459 N Cove Dr
- 100 Bay Dr
- 10 Cove Dr
- 35 Waterview Ct
- 187 Shoreline Cir
- 44 Fendley Trace
- 305 S Shore Dr
- 132 Haven Ridge
- 237 Kory Dr
- 3767 Happy Valley Cir
- 73 Elys Ridge
- 45 Paces Landing Dr
- 68 Lancaster Way
- 29 Huling Rd
- 1084 Macedonia Rd
- 209 Walt Sanders Rd Unit A
- 107 Lake Ridge Rd
- 552 The Blvd
- 555 The Blvd
- 54 Stony Oak Dr
- 113 Westminster Way
- 1 Lakemont Dr
- 143 Riva Ridge Ln
- 140 Brentwood Dr
- 410 Rosewood Ln
- 373 Smokewood Way
- 31 Elaine Dr
- 169 Roscoe Rd
- 140 Jefferson Pkwy