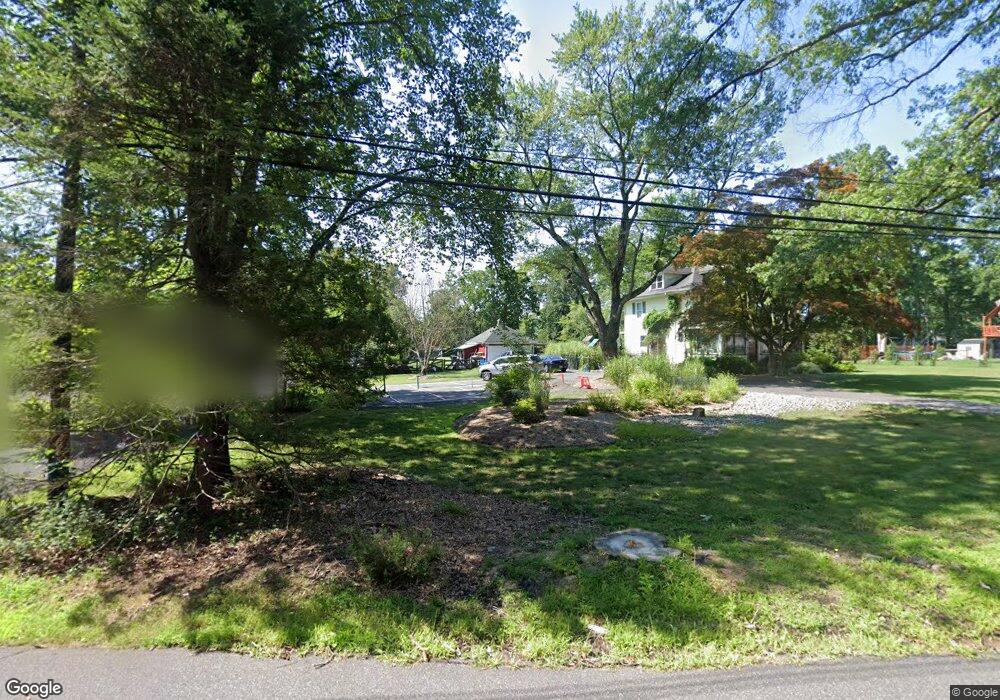
16 W Main St High Bridge, NJ 08829
Estimated Value: $523,000 - $657,000
--
Bed
--
Bath
1,540
Sq Ft
$366/Sq Ft
Est. Value
About This Home
This home is located at 16 W Main St, High Bridge, NJ 08829 and is currently estimated at $563,817, approximately $366 per square foot. 16 W Main St is a home located in Hunterdon County with nearby schools including High Bridge Elementary School, High Bridge Middle School, and Voorhees High School.
Ownership History
Date
Name
Owned For
Owner Type
Purchase Details
Closed on
Mar 22, 2006
Sold by
Ossi Robert and Jensen Roslind
Bought by
Dorwart Karl and Dorwart Maureen
Current Estimated Value
Home Financials for this Owner
Home Financials are based on the most recent Mortgage that was taken out on this home.
Original Mortgage
$373,350
Outstanding Balance
$213,487
Interest Rate
6.37%
Mortgage Type
Fannie Mae Freddie Mac
Estimated Equity
$350,330
Purchase Details
Closed on
Feb 5, 2001
Sold by
Krienitz Kim
Bought by
Ossi Robert and Jensen Roslind
Home Financials for this Owner
Home Financials are based on the most recent Mortgage that was taken out on this home.
Original Mortgage
$240,000
Interest Rate
7.13%
Purchase Details
Closed on
Apr 17, 1998
Sold by
Sigler Virginia F
Bought by
Krienitz Kim
Home Financials for this Owner
Home Financials are based on the most recent Mortgage that was taken out on this home.
Original Mortgage
$171,000
Interest Rate
7.11%
Create a Home Valuation Report for This Property
The Home Valuation Report is an in-depth analysis detailing your home's value as well as a comparison with similar homes in the area
Home Values in the Area
Average Home Value in this Area
Purchase History
| Date | Buyer | Sale Price | Title Company |
|---|---|---|---|
| Dorwart Karl | $385,000 | None Available | |
| Ossi Robert | $300,000 | -- | |
| Krienitz Kim | $190,000 | -- |
Source: Public Records
Mortgage History
| Date | Status | Borrower | Loan Amount |
|---|---|---|---|
| Open | Dorwart Karl | $373,350 | |
| Previous Owner | Ossi Robert | $240,000 | |
| Previous Owner | Krienitz Kim | $171,000 |
Source: Public Records
Tax History Compared to Growth
Tax History
| Year | Tax Paid | Tax Assessment Tax Assessment Total Assessment is a certain percentage of the fair market value that is determined by local assessors to be the total taxable value of land and additions on the property. | Land | Improvement |
|---|---|---|---|---|
| 2025 | $13,882 | $452,100 | $173,500 | $278,600 |
| 2024 | $12,680 | $425,300 | $164,000 | $261,300 |
| 2023 | $12,680 | $320,700 | $120,200 | $200,500 |
| 2022 | $13,646 | $320,700 | $120,200 | $200,500 |
| 2021 | $13,223 | $320,100 | $120,200 | $199,900 |
| 2020 | $13,124 | $320,100 | $120,200 | $199,900 |
| 2019 | $13,223 | $320,100 | $120,200 | $199,900 |
| 2018 | $12,686 | $320,100 | $120,200 | $199,900 |
| 2017 | $11,550 | $299,700 | $120,200 | $179,500 |
| 2016 | $11,416 | $299,700 | $120,200 | $179,500 |
| 2015 | $11,107 | $299,700 | $120,200 | $179,500 |
| 2014 | $12,200 | $355,800 | $150,400 | $205,400 |
Source: Public Records
Map
Nearby Homes