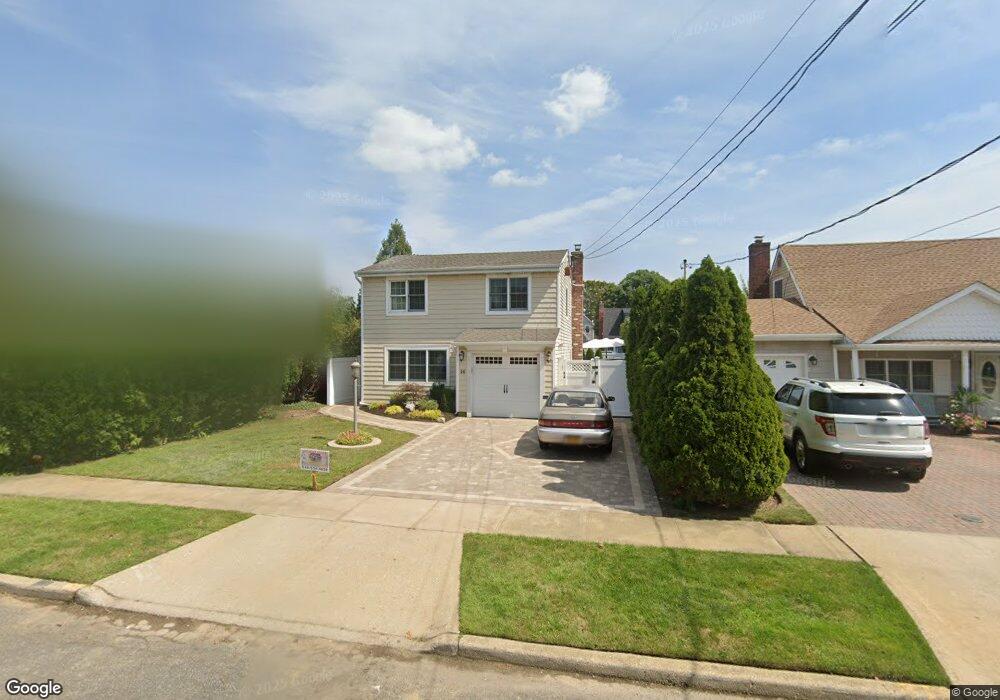
16 W Shore Dr Massapequa, NY 11758
Estimated Value: $697,612 - $828,000
--
Bed
2
Baths
1,500
Sq Ft
$509/Sq Ft
Est. Value
About This Home
This home is located at 16 W Shore Dr, Massapequa, NY 11758 and is currently estimated at $762,806, approximately $508 per square foot. 16 W Shore Dr is a home located in Nassau County with nearby schools including Berner Middle School, Massapequa High School - Ames Campus, and Massapequa High School.
Ownership History
Date
Name
Owned For
Owner Type
Purchase Details
Closed on
Nov 17, 1998
Current Estimated Value
Home Financials for this Owner
Home Financials are based on the most recent Mortgage that was taken out on this home.
Original Mortgage
$181,600
Outstanding Balance
$39,006
Interest Rate
6.68%
Mortgage Type
Purchase Money Mortgage
Estimated Equity
$723,800
Create a Home Valuation Report for This Property
The Home Valuation Report is an in-depth analysis detailing your home's value as well as a comparison with similar homes in the area
Home Values in the Area
Average Home Value in this Area
Purchase History
| Date | Buyer | Sale Price | Title Company |
|---|---|---|---|
| -- | $227,000 | -- | |
| -- | $227,000 | -- |
Source: Public Records
Mortgage History
| Date | Status | Borrower | Loan Amount |
|---|---|---|---|
| Open | Not Available From The Data Source | $181,600 | |
| Closed | Not Available From The Data Source | $181,600 |
Source: Public Records
Tax History Compared to Growth
Tax History
| Year | Tax Paid | Tax Assessment Tax Assessment Total Assessment is a certain percentage of the fair market value that is determined by local assessors to be the total taxable value of land and additions on the property. | Land | Improvement |
|---|---|---|---|---|
| 2025 | $12,835 | $509 | $163 | $346 |
| 2024 | $3,722 | $523 | $168 | $355 |
| 2023 | $11,424 | $512 | $164 | $348 |
| 2022 | $11,424 | $533 | $171 | $362 |
| 2021 | $11,683 | $514 | $165 | $349 |
| 2020 | $11,021 | $680 | $625 | $55 |
| 2019 | $10,187 | $729 | $628 | $101 |
| 2018 | $10,100 | $778 | $0 | $0 |
| 2017 | $8,731 | $1,025 | $670 | $355 |
| 2016 | $13,100 | $1,025 | $670 | $355 |
| 2015 | $3,891 | $1,025 | $670 | $355 |
| 2014 | $3,891 | $1,025 | $670 | $355 |
| 2013 | $3,535 | $1,025 | $670 | $355 |
Source: Public Records
Map
Nearby Homes
- 75 Unqua Rd
- 5 Huron Ave
- 86 Unqua Rd
- 92 Suffolk Rd
- 35 Red Oak Place
- 108 Block Blvd
- 49 Iroquois St E
- 34 Andrews Dr
- 102 Shinnecock Ave
- 3 Neptune Place
- 321 Brendan Ave
- 1 Ozone Place
- 3 Ozone Place
- 61 Birch Ln
- 55 Laurel Dr
- 200 Saint Regis Dr
- 136 Reiss Ave
- 45 Carman Mill Rd
- 22 Mansfield Dr
- 115 Primrose Ave